EnMAP Cookbook
The following examples show how to interact with the EnMAP-Box GUI. They are available unittest TestCases in examples/api_examples.py
Important
For simplicity, we always import the following Qt and QGIS libraries globally:
from qgis.core import *
from qgis.gui import *
from qgis.PyQt.QtWidgets import *
from qgis.PyQt.QtGui import *
from qgis.PyQt.QtCore import *
So we can use several classes like QgsMapCanvas or QWidget and do not need to import them explicitly.
1. Start the EnMAP-Box
As we like to start our examples from an IDE like PyCharm, we first need to start a QgsApplication. It provides the main GUI loop that receives user interactions, like mouse clicks and keyboard entries:
from enmapbox.testing import start_app
qgsApp = start_app()
Now we can start and open the EnMAP-Box and load some example data:
from enmapbox import EnMAPBox
enmapBox = EnMAPBox(None)
enmapBox.openExampleData()
qgsApp.exec_()
If we would’nt call the GUI loop with qgsApp.exec_(), our program will terminate immediately.
The EnMAPBox object is a singleton, which means that there exist only one EnMAPBox instance. You can connect to a running EnMAP-Box instance like this:
from enmapbox import EnMAPBox
enmapBox = EnMAPBox.instance()
print(enmapBox)
Finally, shut down the EnMAP-Box instance:
enmapBox = EnMAPBox.instance()
enmapBox.close()
2. Data Sources
Add Data Sources
The EnMAP-Box differentiates between Raster, Vector, Spectral Libraries and other data sources. To add new data sources,
you just need to provide a file-path or other unique resource identifier via enmapBox.addSource(r'uri')
enmapBox = EnMAPBox.instance()

# add some data sources
from enmapboxtestdata import enmap as pathRasterSource
from enmapboxtestdata import landcover_polygons as pathVectorSource
from enmapboxtestdata import library as pathSpectralLibrary

#add a single source
enmapBox.addSource(pathRasterSource)

#add a list of sources
enmapBox.addSources([pathVectorSource, pathSpectralLibrary])
A the EnMAP-Box uses the QGIS API to visualize spatial data, we can add OpenGIS Web Services (OWS) like Web Map Services (WMS) and Web Feature Services (WFS) as well:
  wmsUri = 'referer=OpenStreetMap%20contributors,%20under%20ODbL&type=xyz&url=https://tiles.wmflabs.org/hikebike/%7Bz%7D/%7Bx%7D/%7By%7D.png&zmax=17&zmin=1'
  wfsUri = r'restrictToRequestBBOX=''1'' srsname=''EPSG:25833'' typename=''fis:re_postleit'' url=''https://fbinter.stadt-berlin.de/fb/wfs/geometry/senstadt/re_postleit'' version=''auto'''
  enmapBox.addSource(wmsUri, name="Open Street Map")
  enmapBox.addSource(wfsUri, name='Berlin PLZ')

.. image:: ../img/gstart_datasources.png
   :width: 100%
List Existing Data Sources
You can iterate over all or specific type of data sources:
for source in enmapBox.dataSources():
    print(source)

for source in enmapBox.dataSources('RASTER'):
    print(source)
Remove Data Sources
Data sources can be removed by its source path:
enmapBox = EnMAPBox.instance()
enmapBox.removeSource('source_path')

# or remove multiple sources
enmapBox.removeSources(['list-of-source_path'])
Data Sources are unique
EnMAP-Box Data sources are unique; which means that only one data source refers to the same source path. Adding the same source multiple times does not change the total number of data sources:
from enmapbox import EnMAPBox
from enmapboxtestdata import enmap

enmapBox = EnMAPBox(None)
enmapBox.addSource(enmap)
print('# data sources: {}'.format(len(enmapBox.dataSources())))

# add the same source again
enmapBox.addSource(enmap)
print('# data sources: {}'.format(len(enmapBox.dataSources())))
Note
Data sources are internally described by the enmapbox.gui.datasources.DataSource class.
A DataSource object stores information on the data source uri, name, type and its creation date.
Receive data source changes:
The Qt Signals sigDataSourceAdded and sigDataSourceAdded can be used to be informed on changes of the EnMAP-Box data sources:
from enmapbox import EnMAPBox

enmapBox = EnMAPBox(None)
enmapBox.sigDataSourceAdded.connect(lambda uri:print('DataSource added: {}'.format(uri)))
enmapBox.sigDataSourceRemoved.connect(lambda uri: print('DataSource removed: {}'.format(uri)))
Overwriting a file source and adding it again to the EnMAP-Box will remove the data source first and add it’s again. This allows to react on changes and to ensure data integrity, e.g. to account for changes in file size and metadata.
Create a text file and add it to the EnMAP-Box:
import tempfile, os, time
tempDir = tempfile.mkdtemp()
pathFile = os.path.join(tempDir, 'testfile.txt')

with open(pathFile, 'w', encoding='utf-8') as f:
    f.write('First version')

assert os.path.isfile(pathFile)
enmapBox.addSource(pathFile)
assert len(enmapBox.dataSources()) == 1
This creates a printout like:
DataSource added: C:\Users\user\AppData\Local\Temp\tmp4gjczg1u\testfile.txt
Wait a while, then overwrite the text file and add it again:
time.sleep(2)

with open(pathFile, 'w', encoding='utf-8') as f:
    f.write('Second version')

assert os.path.exists(pathFile)
enmapBox.addSource(pathFile)
assert len(enmapBox.dataSources()) == 1
The shell printouts should be like:
DataSource removed: C:\Users\user\AppData\Local\Temp\tmp4gjczg1u\testfile.txt
DataSource added: C:\Users\user\AppData\Local\Temp\tmp4gjczg1u\testfile.txt
3. Dock Windows
The EnMAP-Box Docks to visualize spatial data and spectral libraries. Docks are based on the pyqtgraphDock which inherits QDockWidget, but can be arranged much more flexible, e.g. in nested layouts. We use these Docks as containers for specialized widgets, in particular the enmapbox.gui.mapcanvas.MapCanvas (as MapDock) and the SpectralLibraryWidget (SpectralLibraryDock).
You can create new docks with EnMAPBox.createDock('<dockType>'):
from enmapbox.gui.enmapboxgui import EnMAPBox, Dock, MapDock, SpectralLibraryDock
enmapBox = EnMAP-Box.instance()

enmapBox.createDock('MAP')  # a spatial map
enmapBox.createDock('SPECLIB') # a spectral library
enmapBox.createDock('TEXT') # a text editor
enmapBox.createDock('WEBVIEW') # a browser
enmapBox.createDock('MIME') # a window to drop mime data (for developers)
Dock titles, visibility and behaviour can be modified:
# modify dock properties
mapDock1 = enmapBox.createDock('MAP')
mapDock2 = enmapBox.createDock('MAP')
mapDock3 = enmapBox.createDock('MAP')

# set dock title
mapDock1.setTitle('Map 1 (fixed)')
mapDock2.setTitle('Map 2 (floated)')
mapDock3.setTitle('Map 3 (hidden)')

mapDock2.float()
mapDock3.setVisible(False)
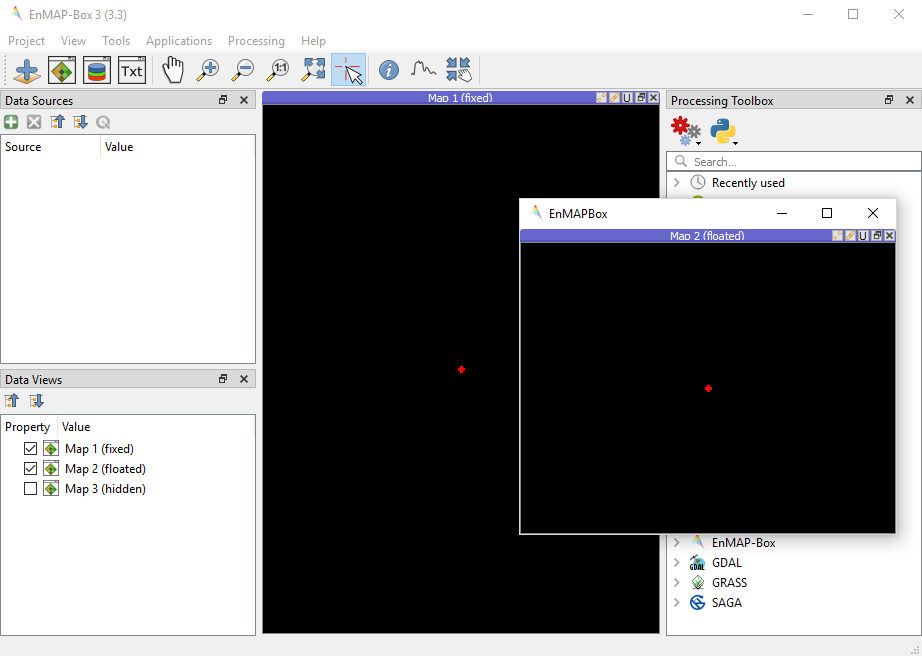
Fig. 41 Three map docks. Map 3 is hidden and therefore visible in the dock manager panel only.
Docks can be accessed similar to DataSources:
from enmapbox.gui.docks import Dock, SpectralLibraryDock
for dock in enmapBox.dockManager().docks():
    assert isinstance(dock, Dock)
    print(dock)
The dockType keyword serves as filter:
# list map docks only
for dock in enmapBox.dockManager().docks(dockType='MAP'):
    assert isinstance(dock, Dock)
    print(dock)

# list all spectral library docks
for dock in enmapBox.dockManager().docks(dockType='SPELCIB'):
    assert isinstance(dock, Dock)
    print(dock)
5. Map Tools
QgsMapTools control what happens when a user clicks into a QgsMapCanvas, e.g. to zoom in or zoom out. You can set the current map tool as followed:
from enmapbox.gui import MapTools
enmapBox.setMapTool(MapTools.ZoomIn)
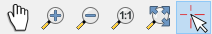
The map tool will be set to all MapCanvases known to the EnMAP-Box, in particular those in MapDocks. Possible map tools are:
Icon |
Key (str) |
Key (Enum) |
Description |
|---|---|---|---|
|
|
Activate pan tool to move the map |
|
|
|
Zoom in |
|
|
|
Zoom Out |
|
|
|
Zoom to the full extend |
|
|
|
Raster pixel have same size like screen pixel |
|
|
|
Select cursor location information |
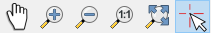
Fig. 42 Map tool icons to pan, zoom in, out, full extent and pixel scale, and to get cursor location information.
6. Spatial Points and Extents
Working with spatial data often requires to convert coordinates between different coordinate reference systems (CRS). The EnMAP-Box classes SpatialPoint and SpatialExtent inherit QgsPointXY and QgsRectangle, respectively and enhance their parent classes by keeping a reference on the QgsCoordinateReferenceSystem used to specify the coordinates.
Retrieve a QgsRasterLayer center coordinate and convert it into geographic lat/lon coordinates:
from enmapboxtestdata import enmap
from enmapbox.gui import SpatialPoint

layer = QgsRasterLayer(enmap)
point = SpatialPoint.fromMapLayerCenter(layer)

targetCrs = QgsCoordinateReferenceSystem('EPSG:4326')

print('Original CRS: "{}"'.format(layer.crs().description()))
print('QgsPointXY  : {}'.format(QgsPointXY(point)))
print('SpatialPoint: {}\n'.format(point))

pointTargetCRS = point.toCrs(targetCrs)
print('Target CRS  : "{}"'.format(targetCrs.description()))
print('QgsPointXY  : {}'.format(QgsPointXY(pointTargetCRS)))
print('SpatialPoint: {}\n'.format(pointTargetCRS))
Same can be done with map layer extents:
from enmapbox.gui import SpatialExtent
extent = SpatialExtent.fromLayer(layer)
print('Original CRS: "{}"'.format(layer.crs().description()))
print('QgsRectangle : {}'.format(QgsRectangle(extent)))
print('SpatialExtent: {}'.format(extent))

extentTargetCRS = point.toCrs(targetCrs)
print('Target CRS: "{}"'.format(targetCrs.description()))
print('QgsRectangle : {}'.format(QgsPointXY(pointTargetCRS)))
print('SpatialExtent: {}'.format(extentTargetCRS))
Note
Be aware that some CRS transformations are not possible and might cause errors. This might happen in particular when transforming coordinates from regional projected CRS, like an UTM Zone, into a CRS that is defined for another region of the world.
7. Map Locations and Spectral Profiles
The EnMAP-Box emits a sigCurrentLocationChanged signal if the Identify map tool is activated and user left-clicks on a map canvas.
from enmapbox.gui import MapTools, SpatialPoint

def printLocation(spatialPoint:SpatialPoint):
    print('Mouse clicked on {}'.format(spatialPoint))

enmapBox.sigCurrentLocationChanged.connect(printLocation)
The overloaded sigCurrentLocationChanged signature can be used to get the map canvas instance where the location was selected from:
def printLocationAndCanvas(spatialPoint: SpatialPoint, canvas:QgsMapCanvas):
    print('Mouse clicked on {} in {}'.format(spatialPoint, canvas))

enmapBox.sigCurrentLocationChanged[SpatialPoint, QgsMapCanvas].connect(printLocationAndCanvas)
If “Identify raster profile” is activated, the EnMAP-Box extracts SpectralProfiles from the raster layer(s) below the mouse-click location. These spectra can be received from the sigCurrentSpectraChanged signal:

def printSpectralProfiles(currentSpectra:list):

    print('{} SpectralProfiles collected'.format(len(currentSpectra)))
    for i, p in enumerate(currentSpectra):
        assert isinstance(p, QgsFeature)
        p = SpectralProfile.fromSpecLibFeature(p)
        assert isinstance(p, SpectralProfile)
        print('{}: {}'.format(i+1, p.values()['y']))

enmapBox.sigCurrentSpectraChanged.connect(printSpectralProfiles)
The last cursor location and/or spectral profiles are saved and can be accessed:
print('Last location: {}'.format(enmapBox.currentLocation()))
print('Last SpectralProfile: {}'.format(enmapBox.currentSpectra()))