2. Graphical User Interfaces
Overview
This tutorial shows you how to create graphical user interfaces (GUI) with Qt, QGIS and the EnMAP-Box. It covers the following aspects:
Basics of GUI programming.
Here you learn the very fundamentals of how to create your own GUI applications with Qt and QGIS. It addresses users that never created a GUI programmatically before.
EnMAP-Box and EnMAP-Box Applications. Here you learn how to bring your widget application into the EnMAP-Box and to interact with an active EnMAP-Box GUI, e.g. to receive spectral profiles selected from a map.
Advanced GUI programming.
Here you find more examples, templates and recommendation to solve specific GUI-related aspects.
Prerequisites
Ensure that you have installed the EnMAP-Box repository and setup your PyCharm environment as described our installation guide for developers.
Part I: Basics
1. Hello World
Creating a GUI with Qt is simple. If we start from scratch, we first need to create a QApplication instance:
from PyQt5.QtWidgets import QApplication, QWidget

app = QApplication([])
This initializes the Qt framework, allows us to draw widgets on screen and to react on user inputs. Now we can create our first widget and show it:
widget = QWidget()
widget.setWindowTitle('Hello World')
widget.show()

app.exec_()
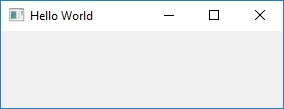
Example 1: An empty Hello World widget.
Tip
QWidget is the base class of all Qt widgets. QWidgets offer several customizations, e.g.:
widget.setFixedSize(150, 200) # change width and height
widget.setVisible(False) # hide the widget
Please note the app._exec_() line. It tells our QApplication instance to enter the event loop.
This loop regularly checks if there are any user inputs, e.g. mouse movements or keyboard events, and react to.
Replace app._exec_() with print('Application finished') and see what happens. The widget might show up for
some milliseconds, but disappears as the main application terminates immediately.
Note
A QApplication already exists if we start from the QGIS python console or when our code is called from an EnMAP-Box instance.
If we start our own python shell, e.g. out of PyCharm, we (i) need to initialize a QApplication and (ii) enter it’s event loop.
A QApplication needs to be instantiated only once. The Qt documentation writes:
For any GUI application using Qt, there is precisely one QApplication object, no matter whether the application has 0, 1, 2 or more windows at any given time. For non-QWidget based Qt applications, use QGuiApplication instead, as it does not depend on the QtWidgets library.
Summary
You now learned to:
initialize a QApplication and start the GUI event loop
create QWidgets and show them on screen
Complete code
def test_example1_hello_world(self):

    from PyQt5.QtWidgets import QApplication, QWidget

    app = QApplication([])

    widget = QWidget()
    widget.setWindowTitle('Hello World')
    widget.show()

    app.exec_()
    print('Application finished')
2. Hello Real World
This tutorial addresses GIS and remote sensing people, so let’s use the QGIS API to visualize real world spatial data.
Similar to the Qt framework and its QApplication, we need to initialize the QGIS API first by creating a QgsApplication. To simplify a couple issues, we use the EnMAP-Box API to do so:
from enmapbox.testing import start_app
app = start_app()
Note
QgsApplication inherits QApplication_, so it’s not required to create a separated one
enmapbox.testing.start_app(...)creates a QgsApplication instance and emulates several aspects of a real QGIS Desktop Application. E.g. it loads different raster drivers, initializes the QGIS Processing Framework and create a QGIS Desktop Application mockup.
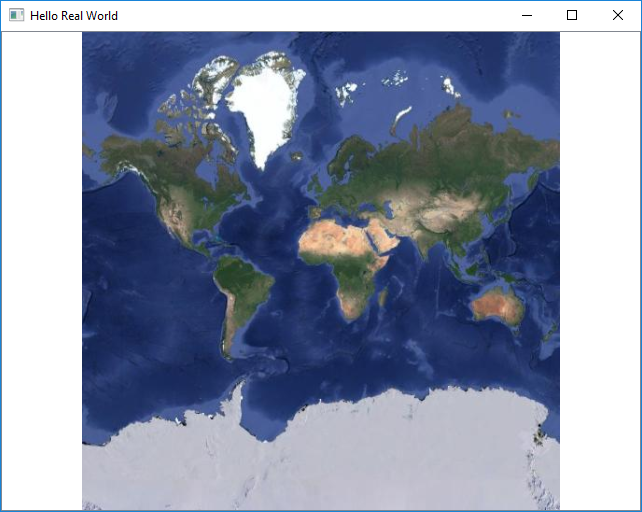
Now we can create a QgsRasterLayer that shows a web map service with the google satellite map:
from qgis.core import QgsRasterLayer
uri = r'crs=EPSG:3857&format&type=xyz&url=https://mt1.google.com/vt/lyrs%3Ds%26x%3D%7Bx%7D%26y%3D%7By%7D%26z%3D%7Bz%7D&zmax=19&zmin=0'
layer = QgsRasterLayer(uri, 'google maps', 'wms')
assert layer.isValid()
The QgsMapCanvas visualizes QgsMapLayers, like our QgsRasterLayer. Before map layers can be rendered, they need to be stored in a QgsMapLayerStore. This will be done if we add them to the current QgsProject instance:
from qgis.gui import QgsMapCanvas
from qgis.core import QgsProject

QgsProject.instance().addMapLayer(layer)

canvas = QgsMapCanvas()
canvas.setWindowTitle('Hello Real World')
canvas.setLayers([layer])
Now we focus the map canvas to the spatial extent of our raster layer and start the application loop:
canvas.setExtent(layer.extent())
canvas.setDestinationCrs(layer.crs())
canvas.show()
app.exec_()
Of course we can visualize local files like from the EnMAP-Box testdata as well:
import enmapboxtestdata
uri = enmapboxtestdata.enmap
layer = QgsRasterLayer(uri)
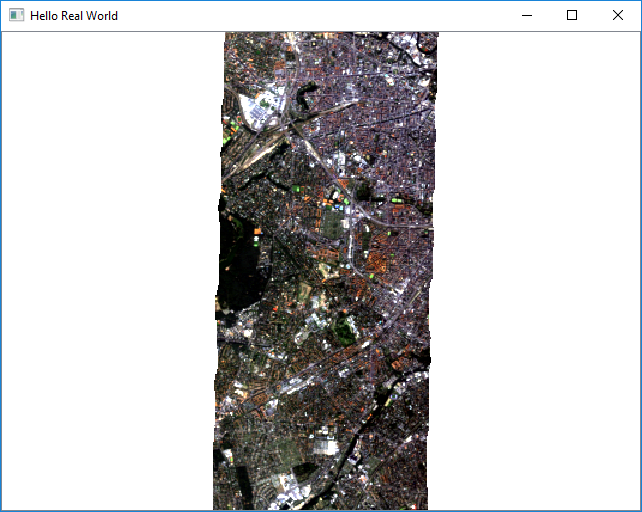
Example 2b: QgsMapCanvas visualizing the EnMAP example image.
The canvas CRS can be set to any CRS of choice. This becomes impressive when reprojecting the global google satellite map into a non-global UTM Zone, like that for 32N(EPSG code 32632):
from qgis.core import QgsCoordinateReferenceSystem
canvas.setDestinationCrs(QgsCoordinateReferenceSystem('EPSG:32632'))

Summary
You now can:
open raster data sources as QgsRasterLayer
visualize QgsMapLayers on a QgsMapCanvas
create a QgsCoordinateReferenceSystem for any EPSG code of interest
specify a map canvas CRS
Full source code
from enmapbox.testing import start_app

app = start_app()

assert isinstance(app, QApplication)
assert isinstance(app, QgsApplication)

uri = r'crs=EPSG:3857&format&type=xyz&url=https://mt1.google.com/vt/lyrs%3Ds%26x%3D%7Bx%7D%26y%3D%7By%7D%26z%3D%7Bz%7D&zmax=19&zmin=0'
layer = QgsRasterLayer(uri, 'google maps', 'wms')

import enmapboxtestdata
layer = QgsRasterLayer(enmapboxtestdata.enmap)

QgsProject.instance().addMapLayer(layer)

assert layer.isValid()


from qgis.gui import QgsMapCanvas
canvas = QgsMapCanvas()
canvas.setWindowTitle('Hello Real World')
canvas.setLayers([layer])
canvas.setExtent(layer.extent())
canvas.setDestinationCrs(layer.crs())
canvas.show()

app.exec_()
3. Create new widgets
Widgets can be small like a single button, but also complex forms which allow to enter various inputs. Technically, a new widget is created by:
inheriting QWidget or one of its child classes, e.g. QDialog
modification of the frontend, e.g. adding other widgets or changing visual properties
modification of the backend modification, e.g. by adding methods to validate user inputs
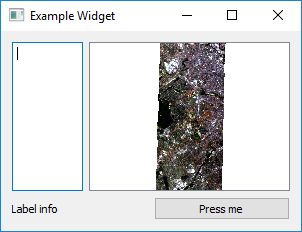
Let’s create a simple widget that contains:
a map to show spatial data
a text box to show multi-line textual data
a label to show other information
a button to reset the map
Create the main widget
First, we create a new class that inherits from QWidget. Because we will need a couple of other widgets as well, we also import the Qt and QGIS widget libraries:
from qgis.core import *
from qgis.gui import *
from qgis.PyQt.QtWidgets import *
from qgis.PyQt.QtGui import *
from qgis.PyQt.QtCore import *

class ExampleWidget(QWidget):

def __init__(self, parent=None):
    super(ExampleWidget, self).__init__(parent)
    self.setWindowTitle('Example Widget')
    self.resize(QSize(300,200))
super(ExampleWidget, self).__init__(parent) calls the constructor of QWidget and initializes all properties
and functions available for QWidgets. To visualize this widget call:
app = start_app()

myWidget = ExampleWidget()
myWidget.show()

app.exec_()
Add child widgets
Now we add other child widgets to the parent widget:
self.textBox = QTextEdit()
self.mapCanvas = QgsMapCanvas()
self.label = QLabel('Label info')
self.button = QPushButton('Press me')
Qt Layout classes control the widget position and resizing behaviour. In this case we want a nested layout that orders widgets in two rows of a major vertical QVBoxLayout. Each row is realized with a QHBoxLayout
self.setLayout(QVBoxLayout())

self.topLayout = QHBoxLayout()
self.topLayout.addWidget(self.textBox)
self.topLayout.addWidget(self.mapCanvas)

self.bottomLayout = QHBoxLayout()
self.bottomLayout.addWidget(self.label)
self.bottomLayout.addWidget(self.button)

self.layout().addLayout(self.topLayout)
self.layout().addLayout(self.bottomLayout)
Finally let’s add some raster data to the map canvas and start our widget:
from enmapboxtestdata import enmap
layer = QgsRasterLayer(enmap)
QgsProject.instance().addMapLayer(layer)
self.mapCanvas.setLayers([layer])
self.mapCanvas.setDestinationCrs(layer.crs())
self.mapCanvas.setExtent(self.mapCanvas.fullExtent())
Summary
Now you can:
create your own widget
order widgets in vertical, horizontal and nested layouts
Full code
ExampleWidget definition
class ExampleWidget(QWidget):

    def __init__(self, parent=None):
        super(ExampleWidget, self).__init__(parent)

        self.setWindowTitle('Example Widget')
        self.resize(QSize(300, 200))

        self.textBox = QTextEdit()
        self.mapCanvas = QgsMapCanvas()
        self.label = QLabel('Label info')
        self.button = QPushButton('Press me')

        self.setLayout(QVBoxLayout())

        self.topLayout = QHBoxLayout()
        self.topLayout.addWidget(self.textBox)
        self.topLayout.addWidget(self.mapCanvas)

        self.bottomLayout = QHBoxLayout()
        self.bottomLayout.addWidget(self.label)
        self.bottomLayout.addWidget(self.button)

        self.layout().addLayout(self.topLayout)
        self.layout().addLayout(self.bottomLayout)

        from enmapboxtestdata import enmap
        layer = QgsRasterLayer(enmap)
        QgsProject.instance().addMapLayer(layer)
        self.mapCanvas.setLayers([layer])
        self.mapCanvas.setDestinationCrs(layer.crs())
        self.mapCanvas.setExtent(self.mapCanvas.fullExtent())
Calling code
app = start_app()

myWidget = ExampleWidget()
myWidget.show()

app.exec_()
4. Signals and Slots
Graphical User Interfaces react on various types of user interactions and inputs. For example
a click on a Start button that starts a time-demanding process
a click on a Cancel button that interrupts a time-demanding process
a tooltip that is shown when the mouse cursor stops over a widget
a text box that changes its background color into red when its input becomes invalid
With Qt, such interactions are often realized with Signals and Slots . All widgets can emit signals to inform other widgets or objects about changes and events. In Qt terminology, functions that are triggered by a signal are called slots.
Connect Signals
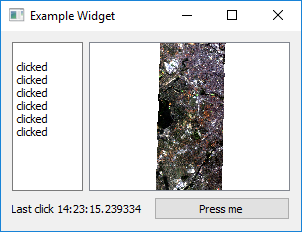
Let’s enhance our ExampleWidget to react on the button’s .clicked() signal. We define the slot function onButtonClicked to add some text to the text box and update the label:
def onButtonClicked(self, *args):
    text = self.textBox.toPlainText()
    text = text + '\nclicked'
    self.textBox.setText(text)

    from datetime import datetime
    self.label.setText('Last click {}'.format(datetime.now().time()))
Then we modify the ExampleWidget’s constructor (__init__) and connect the clicked signal with the onButtonClicked slot:
self.button.clicked.connect(self.onButtonClicked)
In addition we like to reset the map canvas to the full layer extent, e.g. after a user has changed the spatial extent by zooming or panning. We like to keep our source-code clear and short. As the reset operation can be defined in one-line, we use a lambda function as signal-slot:
self.button.clicked.connect(lambda : self.mapCanvas.setExtent(self.mapCanvas.fullExtent()))
Re-start the widget, zoom or pan within the map canvas and click the button:
Create Signals
QObjects like our widget can define and emit their own signals. This might become useful if other widgets need to be informed about changes. Signals are defined like class (not instance) variables:
class ExampleWidget(...)

    sigButtonClicked = pyqtSignal()

    def __init__(...):
        ...
and triggered by and object instance with the emit function:
self.button.clicked.connect(lambda: self.sigButtonClicked.emit())
Overload Signals
You can overload a signal’s signature to emit different sets of arguments:
class ExampleWidget(...)

    sigButtonClicked = pyqtSignal([], [str])

    def __init__(...):
        ...
In this case the signal sigButtonClicked can be emitted without argument or providing an extra string with more information:
self.button.clicked.connect(lambda: self.sigButtonClicked.emit())
self.button.clicked.connect(lambda: self.sigButtonClicked[str].emit('Button  clicked'))
Similarly, you can connect a slot with a signal that provides specific arguments. If you would like to receive the sigButtonClicked definition that also sends some textual information, connect to it like in this example:
myWidget = ExampleWidget()
myWidget.sigButtonClicked[str].connect(lambda text : print('Received: "{}"'.format(text)))
myWidget.show()
Clicking the Examplewidgets button will now print Received: "Button clicked" to the console
Summary
You now can:
use signals and connect them to slots
define lambda functions and use them as singnal-slots
create and emit your own signals
overload signals with different sets of arguments and connect slots to them
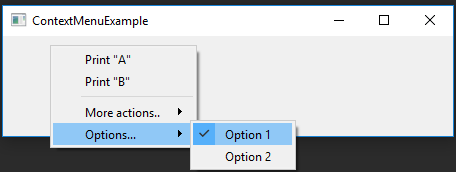
5. Context Menus
Context menus inform users about possible settings and operations. To show a context menu, we need to implement the virtual contextMenuEvent method and execute a QMenu
class ContextMenuExample(QWidget):

    def __init__(self, *args):
        super(ContextMenuExample, self).__init__(*args)
        self.resize(QSize(450, 100))
        self.setWindowTitle('ContextMenuExample')

    def contextMenuEvent(self, event:QContextMenuEvent):
        menu = QMenu()

        action1 = menu.addAction('Print "A"')
        action1.triggered.connect(lambda: print('A'))

        action2 = menu.addAction('Print "B"')
        action2.triggered.connect(lambda: print('B'))

        menu.exec_(event.globalPos())

app = QApplication([])
w = ContextMenuExample()
w.show()
app.exec_()
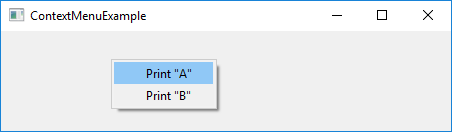
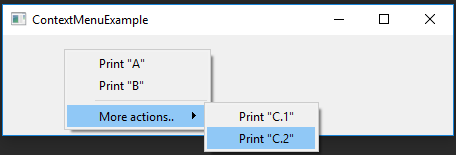
As you see, QActions objects are used to describe menu items. The triggered signal is fired on mouse-click and can be used to call slot functions. More complex QMenus should be structured with separators and child menus:
menu.addSeparator()
subMenu = menu.addMenu('More actions..')
action3 = menu.addAction('Print "C.1"')
action3.triggered.connect(lambda: print('C.1'))

action4 = menu.addAction('Print "C.2"')
action4.triggered.connect(lambda: print('C.2'))
QAction objects can be made checkable. This is useful to present On/Off switches, e.g. to set internal options. For this we define two boolean variables in the class constructor:
class ContextMenuExample(QWidget):

    def __init__(self, *args):
        super(ContextMenuExample, self).__init__(*args)
        self.resize(QSize(450, 100))
        self.setWindowTitle('ContextMenuExample')


        self.option1 = True
        self.option2 = False
and enhance contextMenuEvent(..):
subMenu = menu.addMenu('Options...')

opt1 = subMenu.addAction('Option 1')
opt1.setCheckable(True)
opt1.setChecked(self.option1 == True)
opt1.toggled.connect(lambda b: setattr(self, "option1", b))

opt2 = subMenu.addAction('Option 2')
opt2.setCheckable(True)
opt2.setChecked(self.option2 == True)
opt2.toggled.connect(lambda b: setattr(self, "option2", b))
Summary
You now learned how to:
create and show context menus
create a QAction and use its triggered and toggled signals
overwrite a virtual method / function
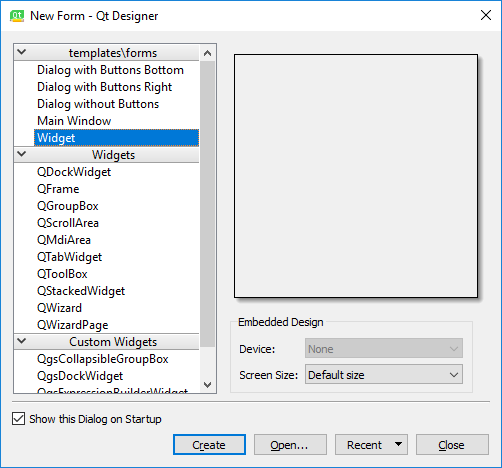
6. Qt Designer
The more widgets your GUI contains, the more you have to specify details like widget positions, layout behaviour, button names etc. Tools like the Qt Designer and Qt Creator allow you to design a GUI frontend by drag ‘n drop, to better focus on what you want to visualize and to separate front-end from background logic.
Draw a Frontend
Start the Qt Designer (or Qt Creator), click on File > New.. and create a new from (exampleform.ui) based on Widget.
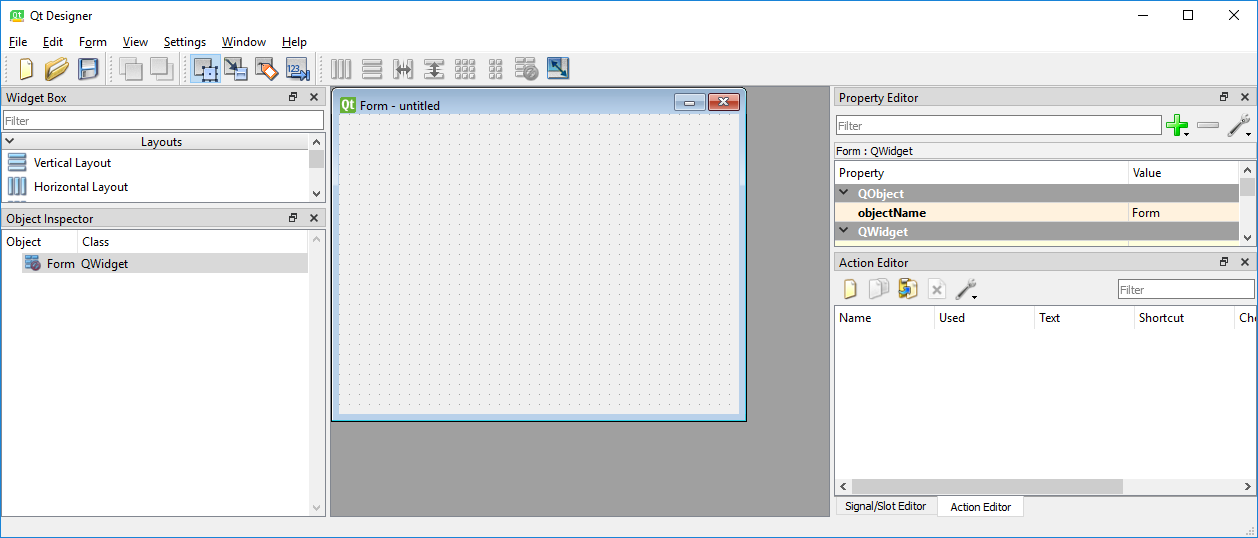
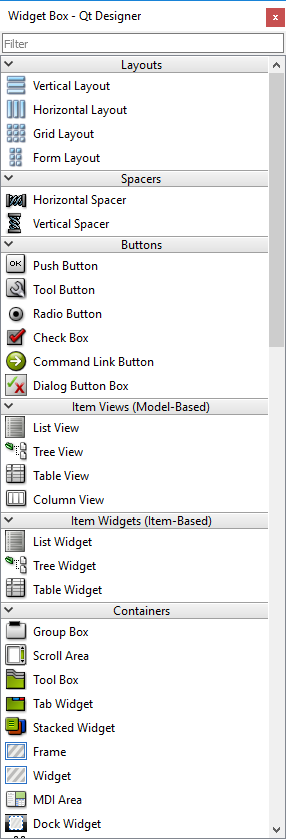
Now take at least 10 minutes to discover the Qt Designer:
Drag and drop widgets from Widget Box to your empty form
Add layouts from the Widget Box to your form and add some widgets
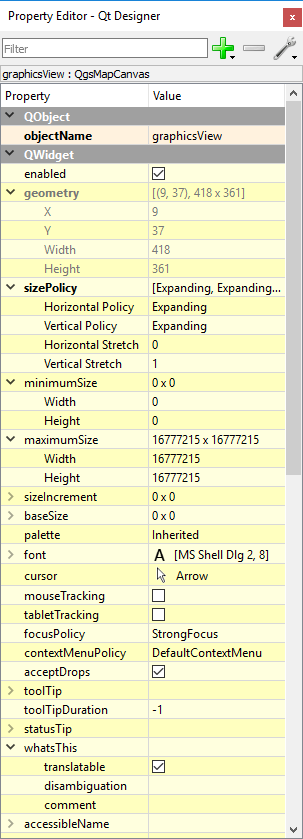
Explore and modify widget properties with the Property Editor
Set tooltips, change minimum and maximum sizes
Visualize previews via View > Preview (or CTRL + P)
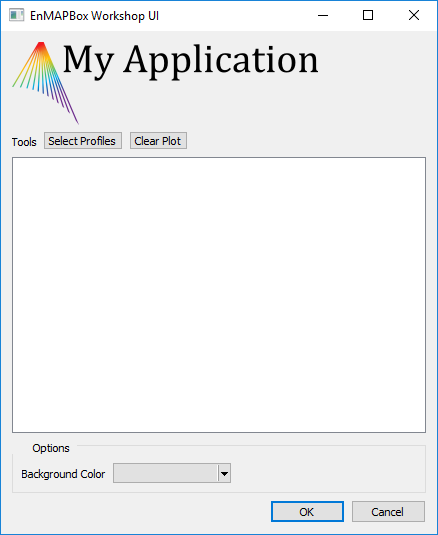
Build a complex UI
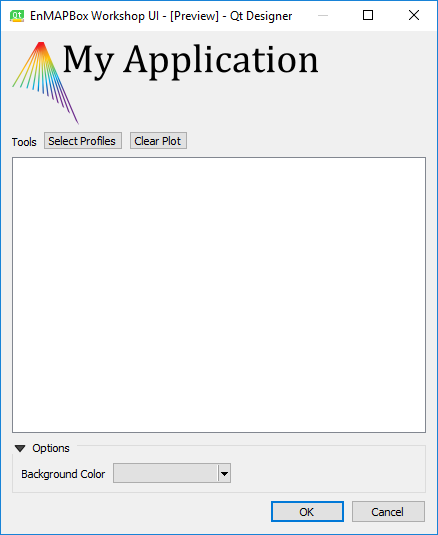
Now we want to create a new widget called EnMAPBoxWorkshopUI, which later on can be used to:
start collecting spectral profiles from a map that is opened in the EnMAP-Box
receive these spectral profiles from the EnMAP-Box and draw them in a plot
For this we first create a new form that derives from QWidget and save it as enmapboxworkshop.ui:
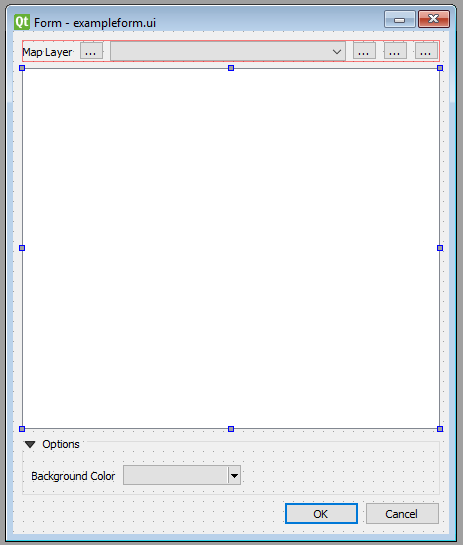
exampleform_reference.ui opened in Qt Designer
the the parent widget’s window title to EnMAPBox Workshop UI
create a QLabel with object name
applicationLogoset the image
programming_tutorial2/tut2_part1_basics/application_logo.svgas background pixmap for the application logocreate a QHBoxLayout that contains:
a QLabel Map Tools
a QToolButton with object name
btnSelectProfiles. It will be used to activate the profile selectiona QToolButton with object name
btnClear. It will be used to clear the plot window
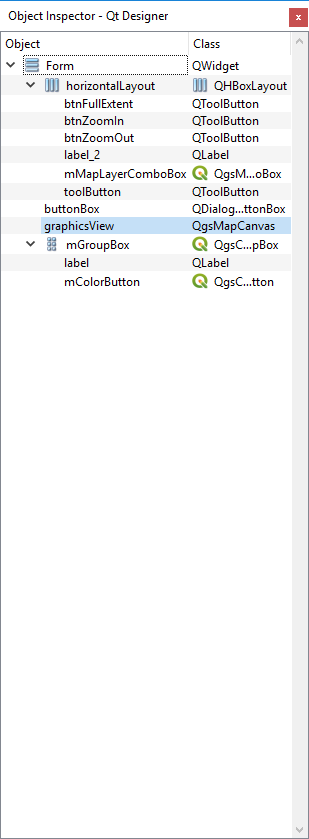
add a QGraphicsView with object name
plotWidgetadd a QgsCollapsibleGroupBox with title Options
add a QLabel Background Color and add a QgsColorButton with object name
btnBackgroundColoruse the preview (Ctrl+R) to check how your widgets look like, in particular when resizing it, or when you collapse or expand the group box

Save your last modification with (CTRL+S) and inspect in an text editor. As you see, the Qt Designer describes the entire frontend in an XML structure.
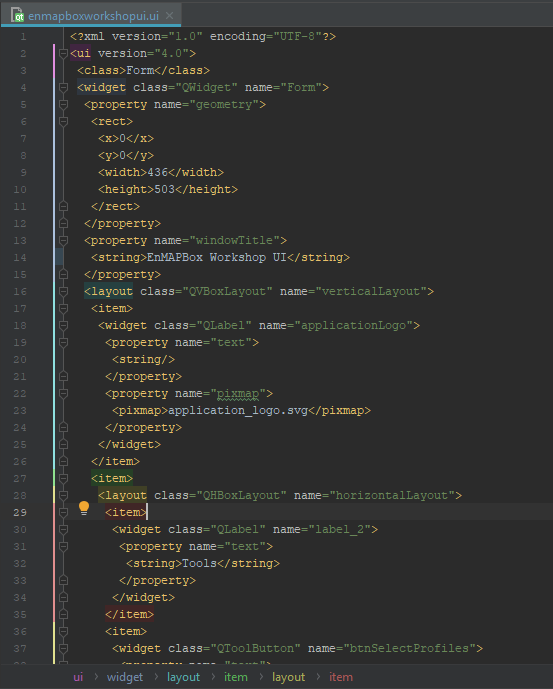
Write the backend
Before we can use our EnMAPBoxWorkshopUI widget from python, we need to write its backend. The backend loads the enmapboxworkshopui.ui and makes all Qt objects available that we have specified in the Qt Designer. It further specifies signals to communicate with other widgets, e.g. a sigSpectralProfileRequest which we will need to inform the EnMAP-Box if we want to collect Spectral Profiles.:
from enmapbox.gui.utils import loadUi
pathUi = os.path.join(os.path.dirname(__file__), 'enmapboxworkshopui.ui')

class EnMAPBoxWorkshopUI(QWidget):

    sigSpectralProfileRequest = pyqtSignal()

    def __init__(self, parent=None):
        super(EnMAPBoxWorkshopUI, self).__init__(parent)
        loadUi(path, self)

        assert isinstance(self.applicationLogo, QLabel)
        assert isinstance(self.btnSelectProfiles, QToolButton)
        assert isinstance(self.btnClear, QToolButton)
        assert isinstance(self.plotWidget, QGraphicsView)
        assert isinstance(self.btnBackgroundColor, QgsColorButton)
Tip
The function enmapbox.gui.utils.loadUi(...) enhances the loadui described in https://www.riverbankcomputing.com/static/Docs/PyQt5/designer.html by
taking care on QGIS and Python specific issues.
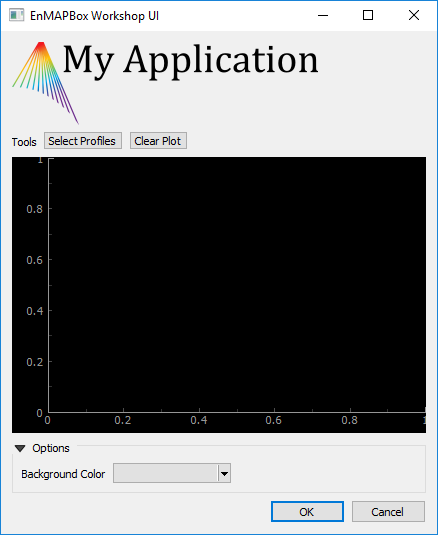
We can now open the EnMAPBoxWorkshopUI from python:
app = start_app()

w = EnMAPBoxWorkshopUI()
w.show()

app.exec_()
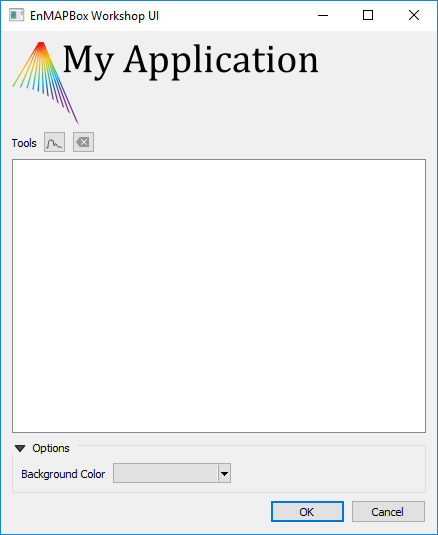
QGIS and EnMAP-Box Icons
There might be a tiny difference between the Qt Designer’s preview [Ctrl+R] and how the widget looks when started from Python.
In this case the missing QgsCollapsibleGroupBox icon has not been loaded into the Qt resource system. However, the icon is available:
if we start our widget from the QGIS python, or
if we load the missing resources manually
Long story short, download the qgsresources.zip and extract it into the enmapbox root folder:
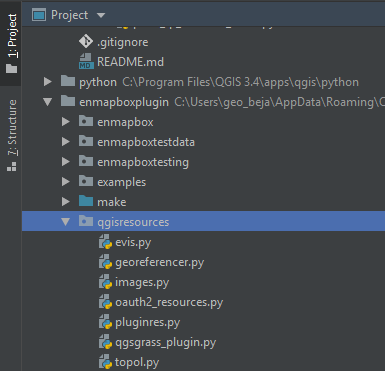
The QGIS icons are available after initializing a QgsApplication with:
from enmapboxtesting import start_app
app = start_app()
To show a QGIS icon, we just need to create a QIcon with the icon’s resource identifier:
self.btnSelectProfiles.setIcon(QIcon('://enmapbox/gui/ui/icons/spectralprofile.svg'))
self.btnClear.setIcon(QIcon(':/images/themes/default/mIconClearText.svg'))
Tip
Read 4. Discover Qt Resource Icons to visualize all icons that are available in a Qt environment.
Promote widgets
You might have realized that some widgets are missing in the widget box, e.g. the QgsMapCanvas that we have used in the first exercises.
So how can we design a GUI frontend with widgets unavailable in the widget box?
In this case we (i) use a widget as a placeholder that is available in the widget box and that (ii) our widget-of-interest inherits from.
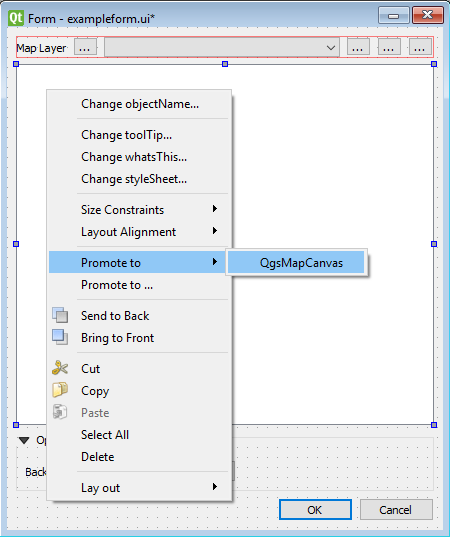
In our EnMAPBoxWorkshopUI we like to plot spectral profiles for which we use a pyqtgraph.PlotWidget. This widget is not available in the widget box, but it inherits from QGraphicsView. Therefore we can promote our QGraphicView (object name plotWidget) into a pyqtgraph.PlotWidget:
#. Open your `enmapboxworkshop.ui`, select the `plotWidget`, right-mouse context menu and open *Promoted Widgets*.
Define a New Promoted Class as
Base class name
QGraphicsView
Promoted class name
PlotWidget
Header file
pyqtgraph.PlotWidget
Click to Add and close the dialog
Now select the plotWidget QGraphicsView object, open its context menu > Promote to.. > PlotWidget
Save your changes (Ctrl+S).
Verify that our plotWidget indeed is a pyqtgraph.PlotWidget instance (and not just a QGraphicsView) with an additional
assert:from pyqtgraph import PlotWidget assert isinstance(self.plotWidget, PlotWidget)
Re-start the EnMAPBoxWorkshopUI to see how the plotWidget has changed into a pyqtgraph.PlotWidget
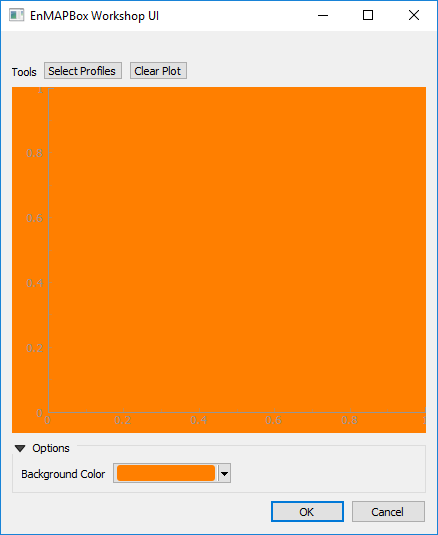
React on User Input
The backend specifies how widgets react on user input. In our case we would like to allow users to set the plot widget’s background color:
self.btnBackgroundColor.setColor(self.plotWidget.backgroundBrush().color())
self.btnBackgroundColor.colorChanged.connect(self.plotWidget.setBackgroundBrush)
Restart the widget and change the background color, e.g. into orange.
Summary
You now can:
use the Qt Designer to create a GUI frontend
promote basic Qt / QGIS widgets into any other derived widgets
write a backend that connects widgets and responses to user inputs
Part II: EnMAP-Box GUI
1. Your GUI in the EnMAP-Box
Let’s create an EnMAPBoxApplication called MyEnMAPBoxWorkshopApplication that brings our EnMAPBoxWorkshopUI into the the EnMAP-Box.
Read the Create EnMAP-Box Applications guide and
Create an folder myworkshopapp that contains everything required for our EnMAP-Box Application:
a module __init__.py that contains the
def enmapboxApplicationFactory(enmapBox).a module workshopapp.py to define the EnMAPBoxApplication interface. It needs to implement
EnMAPBoxApplication.menu(self, appMenu)->QMenu.the application GUI, defined in enmapboxworkshopui.ui (frontend) and enmapboxworkshopui.py (backend)
other resources, e.g. icons
If you have already done the Implementing Processing Algorithms tutorial, you can use and enhance the EnMAPBoxApplication created there (tut1_app1) to implement the
EnMAPBoxApplication.menu(self, appMenu)->QMenumethod
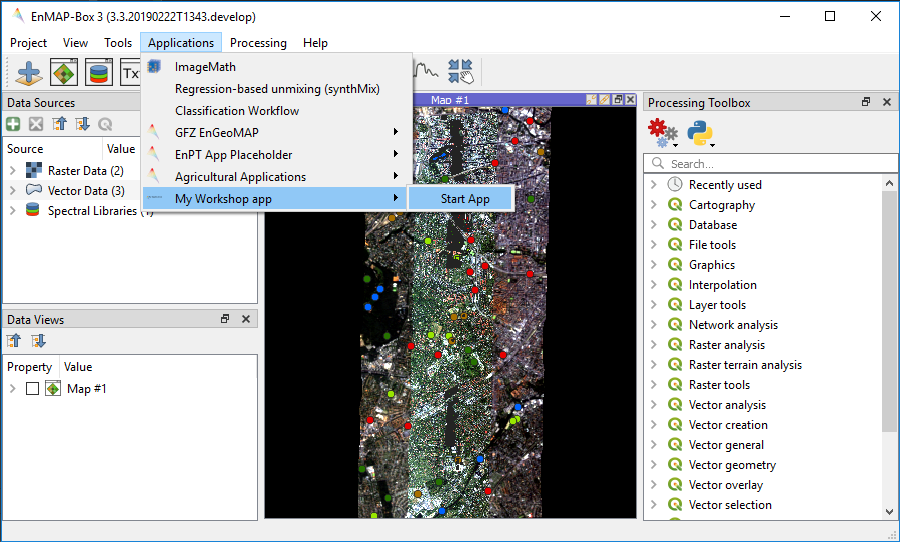
Start the EnMAP-Box and make your application available:
from enmapbox.testing import initQgisApplication
APP = initQgisApplication()

from enmapbox import EnMAPBox, EnMAPBoxApplication
from myworkshopapp.workshopapp import MyEnMAPBoxWorkshopApplication

enmapBox = EnMAPBox(None)
enmapBox.loadExampleData()

myApp = MyEnMAPBoxWorkshopApplication(enmapBox)
assert isinstance(myApp, EnMAPBoxApplication)
enmapBox.addApplication(myApp)

APP.exec_()
Now you can start the application from the EnMAP-Box menu bar
Summary
Now you know:
how to implement an EnMAPBoxApplication interface
how to make your own GUI applications startable in the EnMAP-Box
2. GUI - EnMAP-Box interaction
We would like to enable interactions between our application and the EnMAP-Box. For example:
A click on our applications Select Profile button should activate the EnMAP-Box Identify Location mode with checked Collect Profiles option

If a Spectral Profile is collected, we like to show it in our plot widget
The connection between EnMAP-Box and MyEnMAPBoxWorkshopApplication is created by adding the following lines to MyEnMAPBoxWorkshopApplication.startGUI(…):
# request & receive SpectralProfiles from EnMAP-Box
if isinstance(self.enmapbox, EnMAPBox):
    self.enmapbox.sigCurrentSpectraChanged.connect(w.addSpectralProfiles)
    w.sigSpectralProfileRequest.connect(self.activateSpectralProfileCollection)
The method activateSpectralProfileCollection activates the EnMAP-Box map tools:
def activateSpectralProfileCollection(self):
    """
    Activates the EnMAP-Box Identify location mode + identify profiles
    """
    if isinstance(self.enmapbox, EnMAPBox):
        self.enmapbox.ui.actionIdentify.setChecked(True)
        self.enmapbox.ui.optionIdentifyProfile.setChecked(True)
The EnMAPBoxWorkshopUI gets an addSpectralProfiles(…) to receive and draw collected profiles:
def addSpectralProfiles(self, spectralProfiles:list):
    """
    Plots spectral profiles
    :param spectralProfiles: list of spectral profiles
    """
    from enmapbox.gui import SpectralProfile
    from pyqtgraph import PlotItem, PlotDataItem
    assert isinstance(spectralProfiles, list)

    plotItem = self.plotWidget.getPlotItem()
    assert isinstance(plotItem, PlotItem)

    for spectralProfile in spectralProfiles:
        assert isinstance(spectralProfile, QgsFeature)
        spectralProfile = SpectralProfile.fromSpecLibFeature(spectralProfile)
        assert isinstance(spectralProfile, SpectralProfile)

        pdi = PlotDataItem(x=spectralProfile.xValues(), y=spectralProfile.yValues())
        plotItem.addItem(pdi)
If too many profiles are drawn, users might want to clear the plot, so we enhance EnMAPBoxWorkshopUI by:
def __init__(...)

    ...

    self.btnClear.clicked.connect(self.clearPlot)


def clearPlot(self):
    """
    Removes all plot data items
    """
    self.plotWidget.plotItem.clear()
Summary
You now can:
receive Spectral Profiles from the EnMAP-Box and use them in your own application
plot items with the PyQtGraph library
Part III: Advanced GUI programming
1. Classification Schemes
Classification Schemes are common in remote sensing to describe categorical information, like the CORINE Land Cover classification.
For raster images, Classification Schemes are usually defined as lists of class information, where each class has (i) a numeric label used as pixel value, (ii) a textual class name and (iii) a class color. It is convenient that class labels with value 0 identify no data or unclassified areas, while the other classes use label values > 0.
Label |
Name |
Color |
|---|---|---|
0 |
unclassified |
black |
1 |
impervious |
red |
2 |
low vegetation |
bright green |
3 |
tree |
dark green |
4 |
soil |
brown |
5 |
water |
blow |
Classification Schemes can be used for vector data as well, e.g. to colorize points or polygons.
The EnMAP-Box GUI offers the ClassificationSchemeWidget to create and modify a ClassificationScheme. It allows users to
add / remove classes
modify class names and colors
import classes from other raster files, QgsMapLayers or the clipboard
copy and paste selected classes, e.g. between two ClassificationSchemeWidgets.
The ClassificationSchemeComboBox can be used to select a ClassInfo from a ClassificationScheme:


app = initQgisApplication()
from enmapbox.gui import ClassificationSchemeWidget, ClassificationSchemeComboBox, ClassificationScheme, ClassInfo
from enmapboxtestdata import landcover_polygons


layer = QgsVectorLayer(landcover_polygons)
classificationScheme = ClassificationScheme.fromMapLayer(layer)


classSchemeWidget = ClassificationSchemeWidget(classificationScheme=classificationScheme)
classSchemeWidget.setWindowTitle('Classification Scheme Widget')
classSchemeWidget.show()


classSchemeComboBox = ClassificationSchemeComboBox(classification=classificationScheme)
classSchemeComboBox.setWindowTitle('Classification Scheme ComboBox')
classSchemeComboBox.show()

for classInfo in classificationScheme:
    assert isinstance(classInfo, ClassInfo)
    print('Label: Name:{} Color: {}'.format(
        classInfo.label(),
        classInfo.name(),
        classInfo.color().getRgb()))

app.exec_()
Label: Name:0 Color: low vegetation
Label: Name:1 Color: pavement
Label: Name:2 Color: roof
Label: Name:3 Color: soil
Label: Name:4 Color: tree
Label: Name:5 Color: water
2. Spectral Libraries
The EnMAP-Box GUI supports the visualization and management of raster profiles from different sensors or images in the same plot. For this the EnMAP-Box uses:
the SpectralProfile class to store all information related to a single profile, including metadata like the geographic position and other textual or numeric attributes
the SpectralLibrary class to store multiple SpectralProfiles. A SpectralLibrary is an in-memory point QgsVectorLayer. If SpectralProfiles define a coordinate, they can be visualized as points in a QgsMapCanvas. Attributes can be modified in an attribute table
the SpectralLibraryWidget to visualize and edit a SpectralLibrary
Let’s collect some profiles from the EnMAP testdata image:
from enmapbox.testing import initQgisApplication
app = initQgisApplication()
from enmapbox.gui import SpectralProfile, SpectralLibrary, SpectralLibraryWidget, SpatialPoint, SpatialExtent
from enmapboxtestdata import enmap

# collect 10 SpectraProfiles from center of the EnMAP test image
# to the south in steps of 200 meters

enmapLayer = QgsRasterLayer(enmap)
center = SpatialPoint.fromMapLayerCenter(enmapLayer)

step = 200
profiles = []
for i in range(10):
    position = SpatialPoint(center.crs(), center.x(), center.y() + i*step)
    profile = SpectralProfile.fromRasterSource(enmapLayer, position)
    profile.setName('EnMAP Profile {}'.format(i+1))
    profiles.append(profile)
Now create a SpectralLibrary and add the collected profiles to:
speclib = SpectralLibrary()
speclib.startEditing()
speclib.addProfiles(profiles)
speclib.commitChanges()
Hint
As the SpectralLibrary inherits QgsVectorLayer, it uses a database-like interface to store modifications:
call .startEditing() to enable modifications
call .commitChange() to save modification, or
call .rollBack() to revert modification
In contrast to QgsVectorLayers, you can access the SpectralProfiles of a SpectralLibrary like items of a python list and iterate over them:
print('First profile:'.format(speclib[0]))

print('Number of profiles: {}'.format(speclib))
for i, profile in enumerate(speclib):
    assert isinstance(profile, SpectralProfile)
    print('Profile {} "{}": {}'.format(i, profile.name(), profile.yValues()))
The SpectralLibraryWidget visualize profiles and attributes, and a QgsMapCanvas can be used to show the profile location:
w = SpectralLibraryWidget(speclib=speclib)
w.show()

canvas = QgsMapCanvas()
QgsProject.instance().addMapLayers([enmapLayer, speclib])
canvas.setLayers([speclib, enmapLayer])
canvas.setDestinationCrs(enmapLayer.crs())
canvas.setExtent(SpatialExtent.fromLayer(speclib).toCrs(enmapLayer.crs()))
canvas.show()

app.exec_()
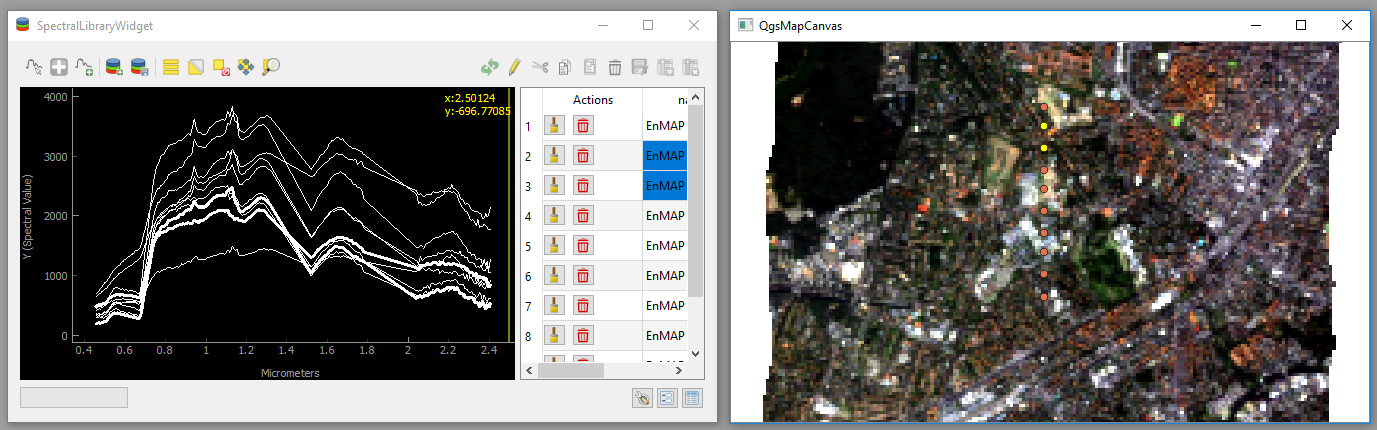
Note
Spectral profiles that got selected in the plot widget or attribute table will be highlighted in the map canvas as well.
3. Create a Tree Model
The Qt Model-View concept allows users to visualize data as a node-tree in a QTreeView. This requires us to implement a QAbstractItemModel that serves as model for a QTreeView. The enmapbox.gui.TreeModel and enmapbox.gui.TreeView class can be used to simplify this development:
from enmapbox.testing import initQgisApplication
app = initQgisApplication()
from enmapbox.gui import TreeView, TreeModel, TreeNode

treeModel = TreeModel()
treeView = TreeView()
treeView.setModel(treeModel)
treeView.setWindowTitle('enmapbox.gui.TreeView')
treeView.show()
The TreeModel has an invisible root node to which we append visible child nodes of type TreeNode:
n1 = TreeNode(treeModel.rootNode(),
              name='First Tree Node',
              icon=QIcon(':/enmapbox/gui/ui/icons/enmapbox.svg'))
n1.setValue(42)
n1.setIcon(QIcon(':/enmapbox/gui/ui/icons/enmapbox.svg'))

n2 = TreeNode(treeModel.rootNode(), name='Node 2')
n2.setName('Second Tree Node, without value')
n1.setIcon(QIcon(':/enmapbox/gui/ui/icons/enmapbox.svg'))
Each TreeNode object can have multiple child nodes:
# define sub nodes
sub1 = TreeNode(n1, name='Sub node 1.1')
sub2 = TreeNode(None, name='Sub node 1.2')
n1.appendChildNodes([sub2])

sub3 = TreeNode(n1, name='Sub node 2.1')
n2.appendChildNodes(sub3)
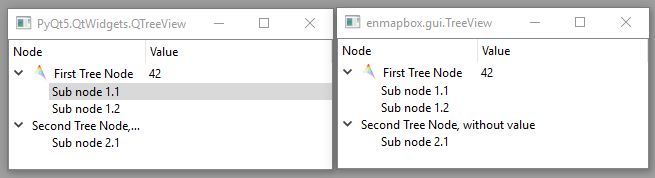
The TreeModel can be used as input model for each QTreeView. Using a enmapbox.gui.TreeView instead will take care of the column span that is expanded for nodes with node name but without a node value:
4. Discover Qt Resource Icons
Icons that have been already loaded to the Qt Resource System can be visualized with the iconselect.AvailableIcons widget. Open the QGIS Python Console and call:
import os.path, sys
from enmapbox.testing import initQgisApplication
app = initQgisApplication()
from enmapbox import DIR_REPO


# ensure that the enmapbox/make folder is added to the PYTHONPATH
dirMakeScripts = os.path.join(DIR_REPO, 'make')
if dirMakeScripts not in sys.path:
    sys.path.append(dirMakeScripts)

import iconselect
iconselect.run()
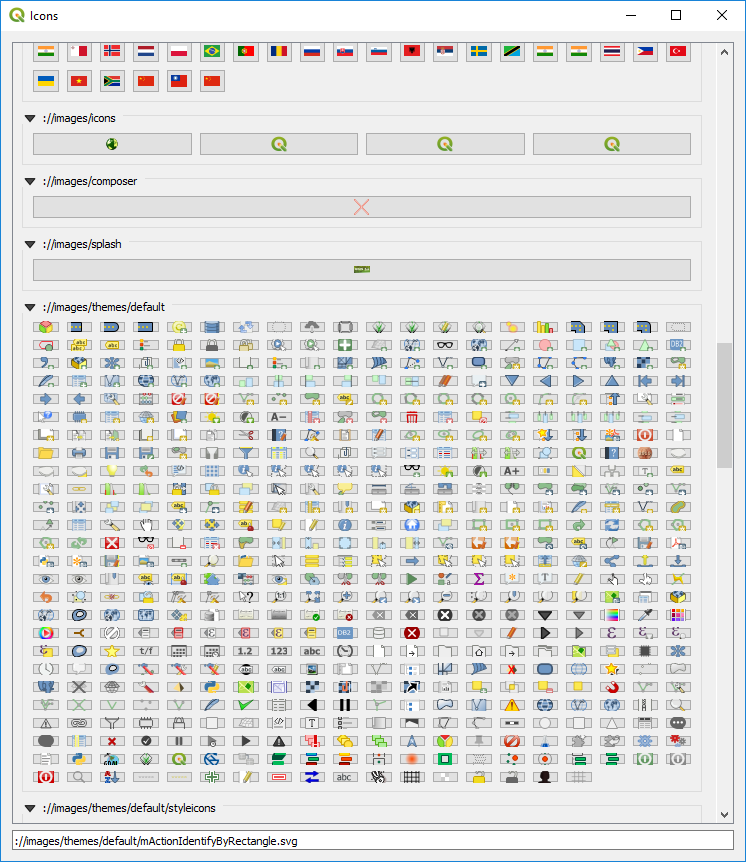
Click on an icon to get its resource path, e.g. ://images/themes/default/mActionIdentifyByRectangle.svg.
The resource path can now be used to open QIcons:
icon = QIcon('://images/themes/default/mActionIdentifyByRectangle.svg')
label = QLabel()
label.setPixmap(icon.pixmap(QSize(100,100)))
label.show()