Part II: EnMAP-Box GUI
1. Your GUI in the EnMAP-Box
Let’s create an EnMAPBoxApplication called MyEnMAPBoxWorkshopApplication that brings our EnMAPBoxWorkshopUI into the the EnMAP-Box.
Read the Create EnMAP-Box Applications guide and
Create an folder myworkshopapp that contains everything required for our EnMAP-Box Application:
a module __init__.py that contains the
def enmapboxApplicationFactory(enmapBox).a module workshopapp.py to define the EnMAPBoxApplication interface. It needs to implement
EnMAPBoxApplication.menu(self, appMenu)->QMenu.the application GUI, defined in enmapboxworkshopui.ui (frontend) and enmapboxworkshopui.py (backend)
other resources, e.g. icons
If you have already done the Implementing Processing Algorithms tutorial, you can use and enhance the EnMAPBoxApplication created there (tut1_app1) to implement the
EnMAPBoxApplication.menu(self, appMenu)->QMenumethod
Start the EnMAP-Box and make your application available:
from enmapbox.testing import initQgisApplication
APP = initQgisApplication()

from enmapbox import EnMAPBox, EnMAPBoxApplication
from myworkshopapp.workshopapp import MyEnMAPBoxWorkshopApplication

enmapBox = EnMAPBox(None)
enmapBox.loadExampleData()

myApp = MyEnMAPBoxWorkshopApplication(enmapBox)
assert isinstance(myApp, EnMAPBoxApplication)
enmapBox.addApplication(myApp)

APP.exec_()
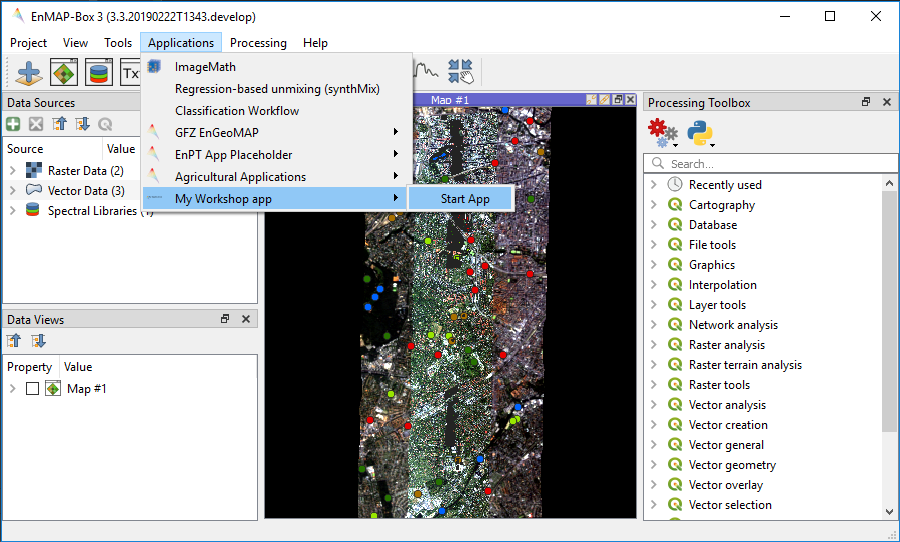
Now you can start the application from the EnMAP-Box menu bar
Summary
Now you know:
how to implement an EnMAPBoxApplication interface
how to make your own GUI applications startable in the EnMAP-Box
2. GUI - EnMAP-Box interaction
We would like to enable interactions between our application and the EnMAP-Box. For example:
A click on our applications Select Profile button should activate the EnMAP-Box Identify Location mode with checked Collect Profiles option

If a Spectral Profile is collected, we like to show it in our plot widget
The connection between EnMAP-Box and MyEnMAPBoxWorkshopApplication is created by adding the following lines to MyEnMAPBoxWorkshopApplication.startGUI(…):
# request & receive SpectralProfiles from EnMAP-Box
if isinstance(self.enmapbox, EnMAPBox):
    self.enmapbox.sigCurrentSpectraChanged.connect(w.addSpectralProfiles)
    w.sigSpectralProfileRequest.connect(self.activateSpectralProfileCollection)
The method activateSpectralProfileCollection activates the EnMAP-Box map tools:
def activateSpectralProfileCollection(self):
    """
    Activates the EnMAP-Box Identify location mode + identify profiles
    """
    if isinstance(self.enmapbox, EnMAPBox):
        self.enmapbox.ui.actionIdentify.setChecked(True)
        self.enmapbox.ui.optionIdentifyProfile.setChecked(True)
The EnMAPBoxWorkshopUI gets an addSpectralProfiles(…) to receive and draw collected profiles:
def addSpectralProfiles(self, spectralProfiles:list):
    """
    Plots spectral profiles
    :param spectralProfiles: list of spectral profiles
    """
    from enmapbox.gui import SpectralProfile
    from pyqtgraph import PlotItem, PlotDataItem
    assert isinstance(spectralProfiles, list)

    plotItem = self.plotWidget.getPlotItem()
    assert isinstance(plotItem, PlotItem)

    for spectralProfile in spectralProfiles:
        assert isinstance(spectralProfile, QgsFeature)
        spectralProfile = SpectralProfile.fromSpecLibFeature(spectralProfile)
        assert isinstance(spectralProfile, SpectralProfile)

        pdi = PlotDataItem(x=spectralProfile.xValues(), y=spectralProfile.yValues())
        plotItem.addItem(pdi)
If too many profiles are drawn, users might want to clear the plot, so we enhance EnMAPBoxWorkshopUI by:
def __init__(...)

    ...

    self.btnClear.clicked.connect(self.clearPlot)


def clearPlot(self):
    """
    Removes all plot data items
    """
    self.plotWidget.plotItem.clear()
Summary
You now can:
receive Spectral Profiles from the EnMAP-Box and use them in your own application
plot items with the PyQtGraph library