Part III: Advanced GUI programming
1. Classification Schemes
Classification Schemes are common in remote sensing to describe categorical information, like the CORINE Land Cover classification.
For raster images, Classification Schemes are usually defined as lists of class information, where each class has (i) a numeric label used as pixel value, (ii) a textual class name and (iii) a class color. It is convenient that class labels with value 0 identify no data or unclassified areas, while the other classes use label values > 0.
Label |
Name |
Color |
|---|---|---|
0 |
unclassified |
black |
1 |
impervious |
red |
2 |
low vegetation |
bright green |
3 |
tree |
dark green |
4 |
soil |
brown |
5 |
water |
blow |
Classification Schemes can be used for vector data as well, e.g. to colorize points or polygons.
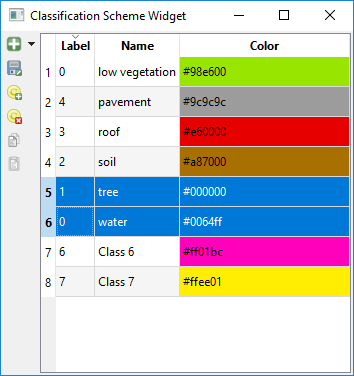
The EnMAP-Box GUI offers the ClassificationSchemeWidget to create and modify a ClassificationScheme. It allows users to
add / remove classes
modify class names and colors
import classes from other raster files, QgsMapLayers or the clipboard
copy and paste selected classes, e.g. between two ClassificationSchemeWidgets.
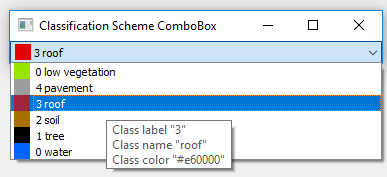
The ClassificationSchemeComboBox can be used to select a ClassInfo from a ClassificationScheme:
app = initQgisApplication()
from enmapbox.gui import ClassificationSchemeWidget, ClassificationSchemeComboBox, ClassificationScheme, ClassInfo
from enmapboxtestdata import landcover_polygons


layer = |QgsVectorLayer(landcover|polygons)
classificationScheme = ClassificationScheme.fromMapLayer(layer)


classSchemeWidget = ClassificationSchemeWidget(classificationScheme=classificationScheme)
classSchemeWidget.setWindowTitle('Classification Scheme Widget')
classSchemeWidget.show()


classSchemeComboBox = ClassificationSchemeComboBox(classification=classificationScheme)
classSchemeComboBox.setWindowTitle('Classification Scheme ComboBox')
classSchemeComboBox.show()

for classInfo in classificationScheme:
    assert isinstance(classInfo, ClassInfo)
    print('Label: Name:{} Color: {}'.format(
        classInfo.label(),
        classInfo.name(),
        classInfo.color().getRgb()))

app.exec_()
Label: Name:0 Color: low vegetation
Label: Name:1 Color: pavement
Label: Name:2 Color: roof
Label: Name:3 Color: soil
Label: Name:4 Color: tree
Label: Name:5 Color: water
2. Spectral Libraries
The EnMAP-Box GUI supports the visualization and management of raster profiles from different sensors or images in the same plot. For this the EnMAP-Box uses:
the SpectralProfile class to store all information related to a single profile, including metadata like the geographic position and other textual or numeric attributes
the SpectralLibrary class to store multiple SpectralProfiles. A SpectralLibrary is an in-memory point QgsVectorLayer. If SpectralProfiles define a coordinate, they can be visualized as points in a QgsMapCanvas. Attributes can be modified in an attribute table
the SpectralLibraryWidget to visualize and edit a SpectralLibrary
Let’s collect some profiles from the EnMAP testdata image:
from enmapbox.testing import initQgisApplication
app = initQgisApplication()
from enmapbox.gui import SpectralProfile, SpectralLibrary, SpectralLibraryWidget, SpatialPoint, SpatialExtent
from enmapboxtestdata import enmap

# collect 10 SpectraProfiles from center of the EnMAP test image
# to the south in steps of 200 meters

enmapLayer = QgsRasterLayer(enmap)
center = SpatialPoint.fromMapLayerCenter(enmapLayer)

step = 200
profiles = []
for i in range(10):
    position = SpatialPoint(center.crs(), center.x(), center.y() + i*step)
    profile = SpectralProfile.fromRasterSource(enmapLayer, position)
    profile.setName('EnMAP Profile {}'.format(i+1))
    profiles.append(profile)
Now create a SpectralLibrary and add the collected profiles to:
speclib = SpectralLibrary()
speclib.startEditing()
speclib.addProfiles(profiles)
speclib.commitChanges()
Hint
As the SpectralLibrary inherits QgsVectorLayer, it uses a database-like interface to store modifications:
call .startEditing() to enable modifications
call .commitChange() to save modification, or
call .rollBack() to revert modification
In contrast to QgsVectorLayers, you can access the SpectralProfiles of a SpectralLibrary like items of a python list and iterate over them:
print('First profile:'.format(speclib[0]))

print('Number of profiles: {}'.format(speclib))
for i, profile in enumerate(speclib):
    assert isinstance(profile, SpectralProfile)
    print('Profile {} "{}": {}'.format(i, profile.name(), profile.yValues()))
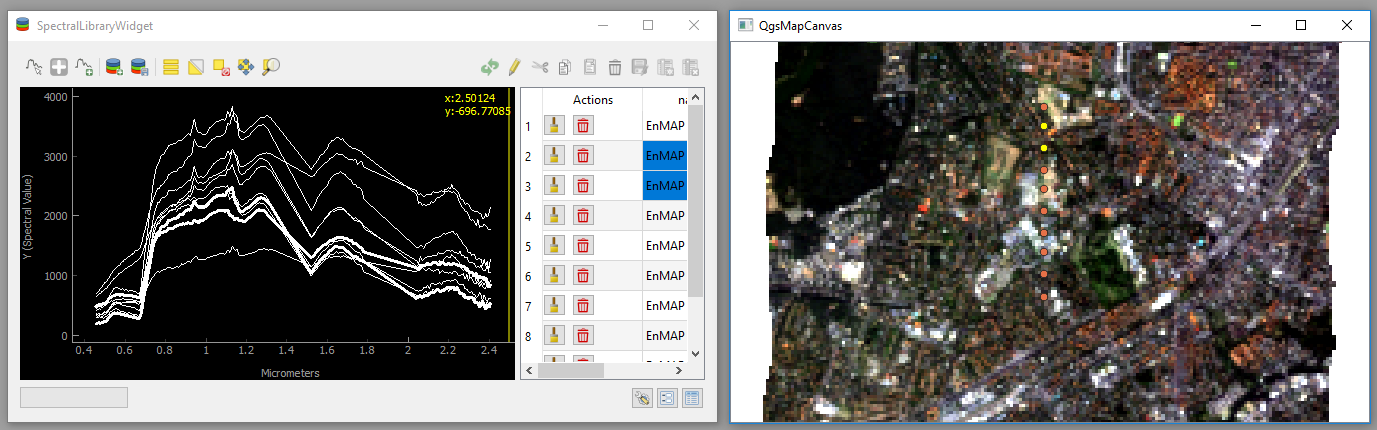
The SpectralLibraryWidget visualize profiles and attributes, and a QgsMapCanvas can be used to show the profile location:
w = SpectralLibraryWidget(speclib=speclib)
w.show()

canvas = QgsMapCanvas()
QgsProject.instance().addMapLayers([enmapLayer, speclib])
canvas.setLayers([speclib, enmapLayer])
canvas.setDestinationCrs(enmapLayer.crs())
canvas.setExtent(SpatialExtent.fromLayer(speclib).toCrs(enmapLayer.crs()))
canvas.show()

app.exec_()
Note
Spectral profiles that got selected in the plot widget or attribute table will be highlighted in the map canvas as well.
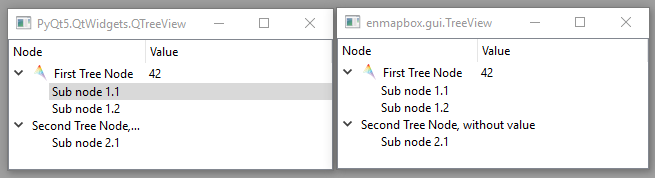
3. Create a Tree Model
The Qt Model-View concept allows users to visualize data as a node-tree in a QTreeView. This requires us to implement a QAbstractItemModel that serves as model for a QTreeView. The enmapbox.gui.TreeModel and enmapbox.gui.TreeView class can be used to simplify this development:
from enmapbox.testing import initQgisApplication
app = initQgisApplication()
from enmapbox.gui import TreeView, TreeModel, TreeNode

treeModel = TreeModel()
treeView = TreeView()
treeView.setModel(treeModel)
treeView.setWindowTitle('enmapbox.gui.TreeView')
treeView.show()
The TreeModel has an invisible root node to which we append visible child nodes of type TreeNode:
n1 = TreeNode(treeModel.rootNode(),
              name='First Tree Node',
              icon=QIcon(':/enmapbox/gui/ui/icons/enmapbox.svg'))
n1.setValue(42)
n1.setIcon(QIcon(':/enmapbox/gui/ui/icons/enmapbox.svg'))

n2 = TreeNode(treeModel.rootNode(), name='Node 2')
n2.setName('Second Tree Node, without value')
n1.setIcon(QIcon(':/enmapbox/gui/ui/icons/enmapbox.svg'))
Each TreeNode object can have multiple child nodes:
# define sub nodes
sub1 = TreeNode(n1, name='Sub node 1.1')
sub2 = TreeNode(None, name='Sub node 1.2')
n1.appendChildNodes([sub2])

sub3 = TreeNode(n1, name='Sub node 2.1')
n2.appendChildNodes(sub3)
The TreeModel can be used as input model for each QTreeView. Using a enmapbox.gui.TreeView instead will take care of the column span that is expanded for nodes with node name but without a node value:
4. Discover Qt Resource Icons
Icons that have been already loaded to the Qt Resource System can be visualized with the iconselect.AvailableIcons widget. Open the QGIS Python Console and call:
import os.path, sys
from enmapbox.testing import initQgisApplication
app = initQgisApplication()
from enmapbox import DIR_REPO


# ensure that the enmapbox/make folder is added to the PYTHONPATH
dirMakeScripts = os.path.join(DIR_REPO, 'make')
if dirMakeScripts not in sys.path:
    sys.path.append(dirMakeScripts)

import iconselect
iconselect.run()
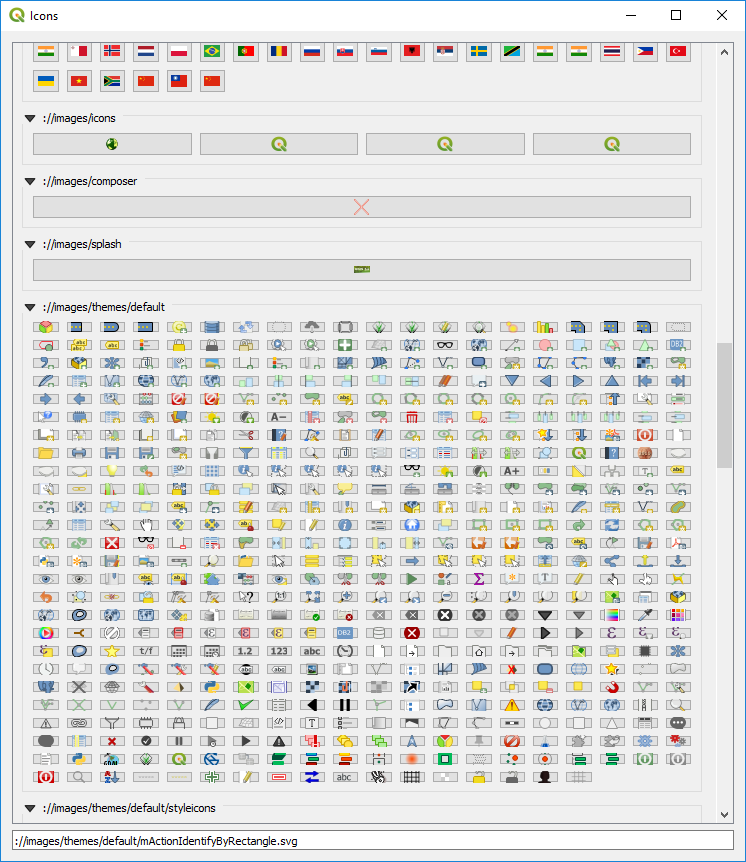
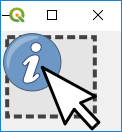
Click on an icon to get its resource path, e.g. ://images/themes/default/mActionIdentifyByRectangle.svg.
The resource path can now be used to open QIcons:
icon = QIcon('://images/themes/default/mActionIdentifyByRectangle.svg')
label = QLabel()
label.setPixmap(icon.pixmap(QSize(100,100)))
label.show()