Features
GUI
The EnMAP-Box offers a powerful graphical user interface (GUI) for an integrated visualization of raster, vector and spectral library data. Move the mouse over the GUI sections for further information.
Visualization
Like QGIS, just more maps
visualize raster and vector data interactively and in multiple maps, e.g. to compare different band combinations or satellite observations.
each map has it’s individual and fully customizable layer-tree
free arrangement of maps, e.g. side-by-side, horizontally, vertically or in nested-layouts
maps can be linked spatially, e.g. to always have the same map scale, show the same map-center, or both
raster layers can be linked spectrally to always show band combinations with similar wavelengths

Think in wavelengths, not band numbers
fast-selection of raster bands and band combination based on wavelength regions
fast-selection of RGB rendering presets based on well-known wavelength combinations, e.g. True Color, NIR-SWIR-Red, …
link raster visualization spectrally to always show similar wavelength combinations, no-matter how many bands your raster sources have

Explore your raster data interactively
The EnMAP-Box provides new raster renderers that enhance the visualization of imaging spectroscopy data and other raster outputs, e.g.:
Bivariate Color Renderer
Visualize two bands using a 2d color ramp.

Class-fraction or probability rendering
Visualizes multiple class factions/probabilities at the same time using the original class colors.

HSV color rendering
Visualizes 3 bands using the HSV (Hue, Saturation, Value/Black) color model

CMYK Color Raster Renderer
Visualizes 4 bands using the CMYK (Cyan, Magenta, Yellow, and Key/Black) color model

Decorelation Stretch Renderer
Removing the high correlation between 3 band for a more colorful color composite image.

Spectral Libraries
Your measurements, your data.
The EnMAP box offers a wide range of options for creating spectral libraries and to describe and visualize their spectral profiles.
Read spectral profiles measured with ASD, SVC (*.sig) or Spectral Evolution (*.sed) field spectrometers
Create profiles from raster images, e.g. for given vector locations (point or polygons)
Save spectral profiles in vector datasets and show their coordinates, e.g. using GeoPackage, GeoJSON or DBMS like PostgreSQL or HANA DB
Keep profiles together that belong together, e.g. reference and target radiances and reflectance derived from
Annotate your profiles as needed, e.g. using text (String, Varchar), numeric (int, float) or binary (BLOB) datatypes
Query your profiles using powerful SQL expressions
Plot profiles from different instruments simultaneously against wavelength units, e.g. nanometers, micrometers

Algorithms
The EnMAP-Box adds more that 190 processing algorithms to the QGIS Processing Framework. Start them from the QGIS/EnMAP-Box GUI, from python, command line interfaces, or connect them with algorithms from other plugins in the QGIS Model Builder.

<show python example>
Open the OSGeo4W or conda shell and call:
qgis_process run enmapbox:PredictClassificationLayer ^
      --raster="%data_dir%\enmap_potsdam.tif" ^
      --classifier="%output_dir%\rfc_fit.pkl" ^
      --matchByName=1 ^
      --outputClassification="%output_dir%\classification.tif"
qgis_process run enmapbox:PredictClassificationLayer \
      --raster="$data_dir/enmap_potsdam.tif" \
      --classifier="$output_dir/rfc_fit.pkl" \
      --matchByName=1 \
      --outputClassification="$output_dir/classification.tif"
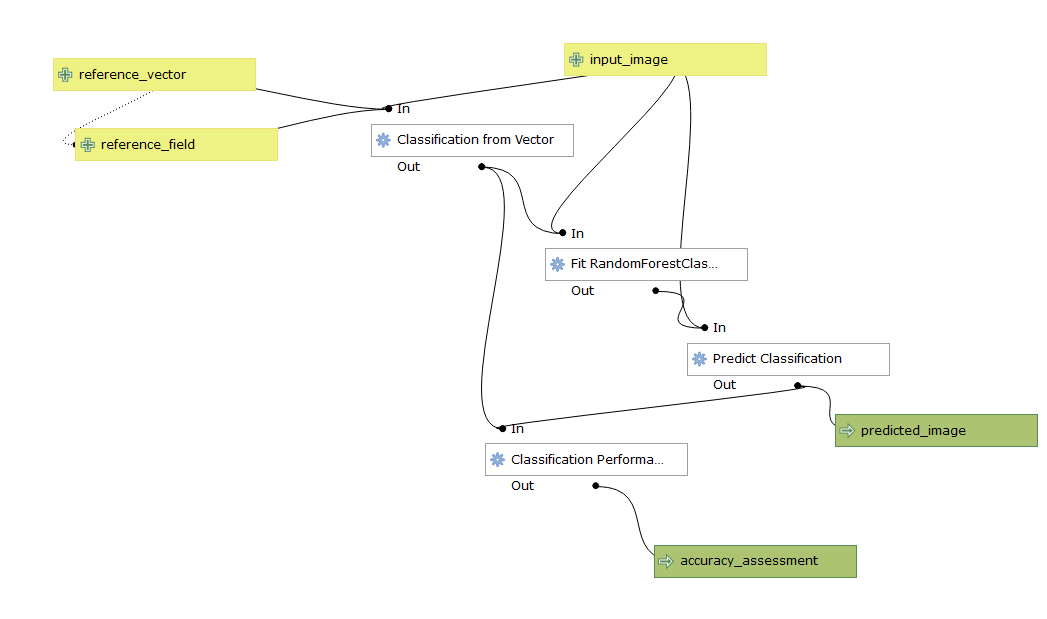
Using the QGIS Model Designer you can connect EnMAP processing algorithms with others and create powerful processing models.
Applications
Various applications enhance the EnMAP-Box to make it ready for different thematic uses, e.g.:
Application |
Keywords |
Description |
|---|---|---|
Analyze Spectral Integral (ASI) |
vegetation |
Wocher et al. 2020, RTM-based dynamic absorption integrals for the retrieval of biochemical vegetation traits, doi: https://doi.org/10.1016/j.jag.2020.102219. |
Classification Workflow |
general, classification |
A workflow to create and apply machine learning classification models. See application description for details. |
Create Look-up-table |
vegetation |
“Wocher et al. 2020, “RTM-based dynamic absorption integrals for the retrieval of biochemical vegetation traits”, doi: https://doi.org/10.1016/j.jag.2020.102219””,,”Wocher et al. 2020 |
EnMAP Geological Mapper (EnGeoMap) |
geology |
Mielke et al. 2018, “Engeomap and Ensomap: Software Interfaces for Mineral and Soil Mapping under Development in the Frame of the Enmap Mission,” in IGARSS 2018 - 2018 IEEE International Geoscience and Remote Sensing Symposium, IEEE, Jul. 2018, pp. 8369–8372. doi: https://doi.org/10.1109/igarss.2018.8517902 |
EnMAP Processing Tool (EnPT) |
preprocessing |
Scheffler et al. 2023, EnPT – an Alternative Pre-Processing Chain for Hyperspectral EnMAP Data, https://doi.org/10.1109/igarss52108.2023.10281805. |
EnMAP Soil Mapper (EnSoMap) |
soil |
Mielke et al. 2018, “Engeomap and Ensomap: Software Interfaces for Mineral and Soil Mapping under Development in the Frame of the Enmap Mission,” in IGARSS 2018 - 2018 IEEE International Geoscience and Remote Sensing Symposium, IEEE, Jul. 2018, pp. 8369–8372. doi: https://doi.org/10.1109/igarss.2018.8517902 |
EO Time Series Viewer |
timeseries |
Jakimow et al. 2020, “Visualizing and labeling dense multi-sensor earth observation time series: The EO time series viewer”, Environmental Modelling & Software, 13648152, 125 (2020), doi: https://doi.org/10.1016/j.envsoft.2020.104631 |
GEE Time Series Explorer |
timeseries |
Rufin et al. 2021, “GEE Timeseries Explorer for QGIS – Instant Access to Petabytes of Earth Observation Data.” The International Archives of the Photogrammetry, Remote Sensing and Spatial Information Sciences, 2194-9034, XLVI-4/W2-2021 (2021), pp. 155-158, doi: https://doi.org/10.5194/isprs-archives-XLVI-4-W2-2021-155-2021 |
Hybrid Retrieval Workflow |
vegetation |
Steinhauser et al. 2024, “Introducing the Potential of the New EnMAP-Box Hybrid Retrieval Workflow for Quantifying Non-Photosynthetic Vegetation”, IEEE International Geoscience and Remote Sensing Symposium (2024), pp. 4073-4076, doi: https://doi.org/10.1109/IGARSS53475.2024.10642095 |
Image Cube |
general, data visualization |
Visualization of hyperspectral raster data in 3D. |
Interactive Red-Edge Inflection Point (iREIP) |
vegetation |
Hank et al. 2021, “Introducing the potential of the EnMAP-box for agricultural applications using desis and prisma data”, IEEE international geoscience and remote sensing symposium (2021), pp. 467-470, doi: https://doi.org/10.1109/IGARSS47720.2021.9554729 |
Interactive Visualization of Vegetation Reflectance Models (IVVRM) |
vegetation, data visualization |
Danner et al. 2018, “Developing a sandbox environment for prosail, suitable for education and research” IEEE international geoscience and remote sensing symposium (2018), pp. 783-786, doi: https://doi.org/10.1109/IGARSS.2018.8519378 |
Invert Look-up-table |
vegetation |
|
OC-PFT |
water |
Retrieval of Phytoplankton Functional Types (PFTs) from satellite or in situ chlorophyll-a (Chl-a) measurements. Alvarado et al. 2022, “Retrievals of the main phytoplankton groups at Lake Constance using OLCI, DESIS, and evaluated with fieldobservations”. 12th EARSeL workshop. 2022. |
OLCI Neural Network Swarm (ONNS) |
water |
Ocean color analysis, Hieronymi et al. 2017, “The OLCI neural network swarm (ONNS): A bio-geo-optical algorithm for open ocean and coastal waters” Front Mar Sci, 2296-7745, 4 (2017), p. 140, doi: https://doi.org/10.3389/fmars.2017.00140 |
Plant Water Retrieval |
vegetation |
Wocher et al. 2018, Physically-Based Retrieval of Canopy Equivalent Water Thickness Using Hyperspectral Data, Remote Sensing https://doi.org/10.3390/rs10121924. |
Raster Math |
general |
Powerful raster calculator that supports multi-band arrays, vector inputs, code and metadata handling. |
Regression Workflow |
general, regression |
A workflow to create and apply machine learning regression models. |
Regression-based unmixing |
unmixing |
Okujeni et al. 2017, Ensemble Learning From Synthetically Mixed Training Data for Quantifying Urban Land Cover With Support Vector Regression. https://doi.org/10.1109/jstars.2016.2634859 |
Scatter Plots |
data visualization |
Interactive scatter plot, See Scatter Plot for details. |
Spectral Imaging Deep Learning Mapper (SpecDeepMap) |
deep learning, image segmentation |
Thomas et al. 2024, Deep learning based semantic segmentation for EnMAP-Box (Poster), 13th EARSeL Workshop on Imaging Spectroscopy. |
Vegetation Index Toolbox Spectral Index Creator |
spectral indices |
Hank et al. 2021, “Introducing the potential of the EnMAP-box for agricultural applications using desis and prisma data”, IEEE international geoscience and remote sensing symposium (2021), pp. 467-470, doi: https://doi.org/10.1109/IGARSS47720.2021.9554729 |
Vegetation Processor |
vegetation |
Danner et al. 2021, “Efficient RTM-based training of machine learning regression algorithms to quantify biophysical & biochemical traits of agricultural crops”, ISPRS J Photogramm Remote Sens, 09242716, 173 (2021), pp. 278-296, doi: https://doi.org/10.1016/j.isprsjprs.2021.01.017 |