Regression
This section will demonstrate a case of image regression using the example data. We will regress the sub-pixel fractions of impervious, vegetation, soil and water, derived from a high resolution land cover polygon vector dataset, against the spectral signature of an EnMAP image. So in this case we are performing a multi target regression (more than one response variable), but mind that single target regression works in the same way.
In a preliminary step we are going to convert the polygon dataset to a fraction raster dataset which fits the resolution of the EnMAP raster. This raster will be the regression target, where each band corresponds to the fraction of a landcover class from the polygon dataset inside an EnMAP pixel (so percentage of impervious, vegetation, soil and water, respectively).
In the processing toolbox go to . Enter the following settings:
Pixel Grid:
enmap_berlin.bsqVector:
landcover_berlin_polygon.shpClass id attribute:
level_1_idMinimal overall coverage: 0.7
Oversampling factor: 5
Output Fraction: Click on … and specify an output file path.
Click Run.
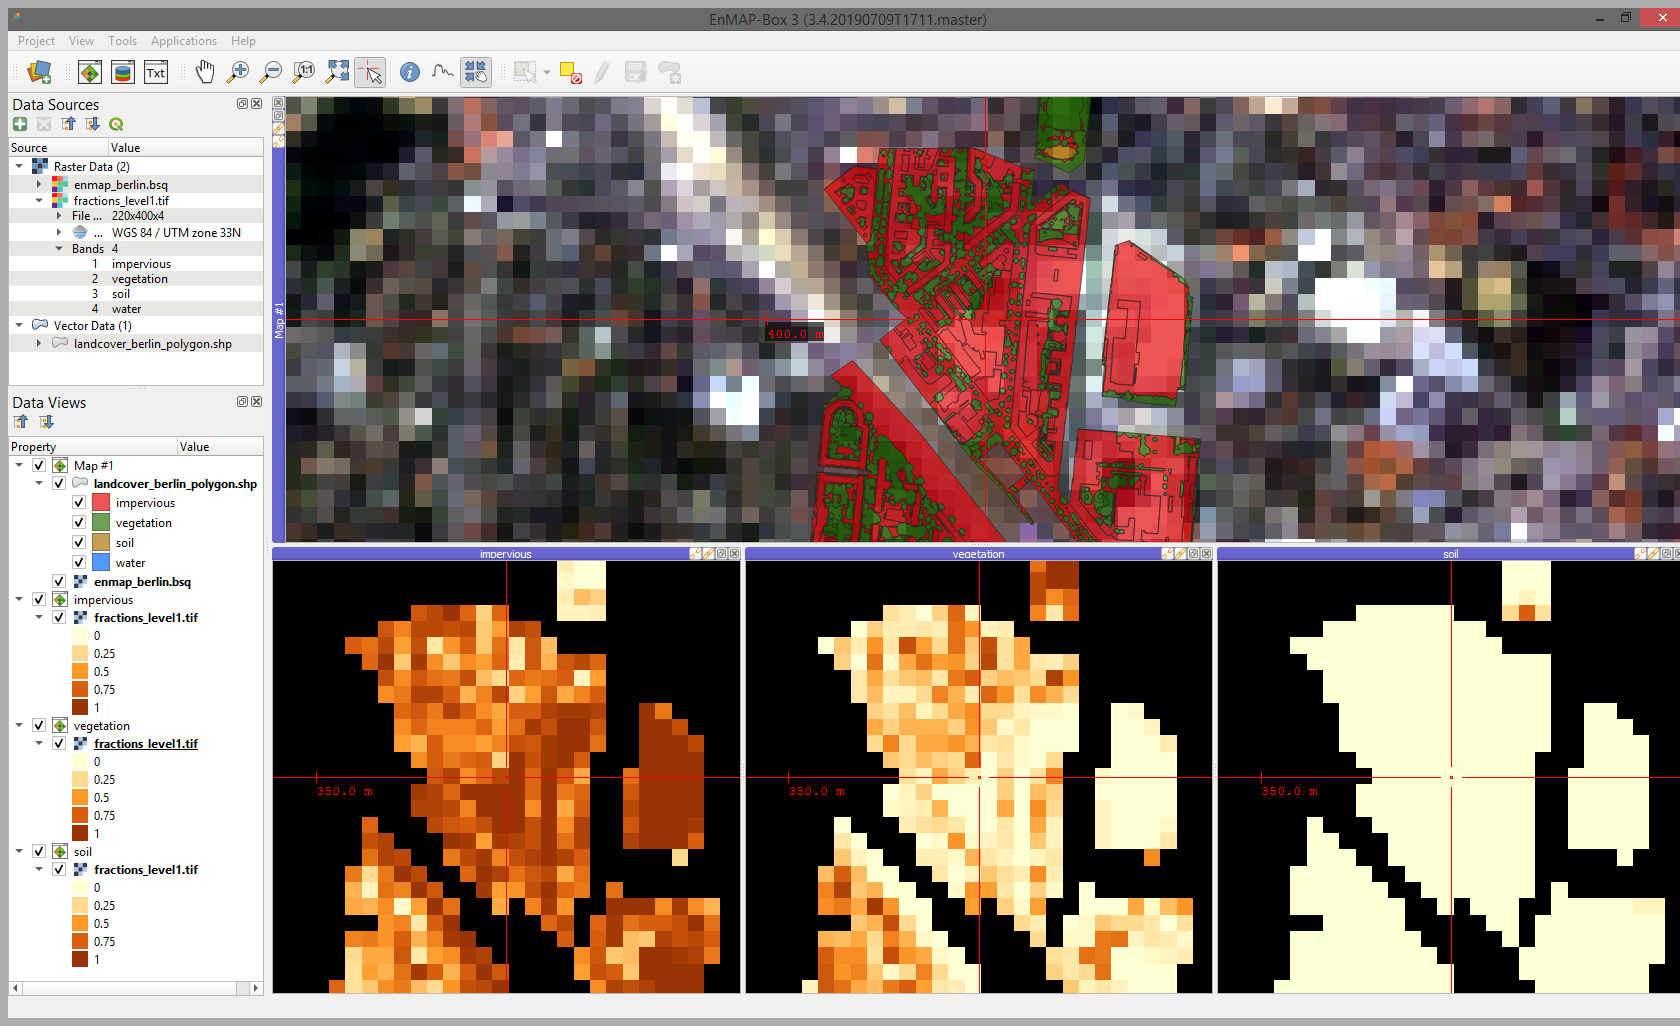
Fig. 19 EnMAP-Box project showing the input EnMAP image and vector dataset (upper map panel) and the respective fraction bands for impervious, vegetation and soil (water is not shown here)
Now that we have a regression target raster we are going to fit a regression model. In the processing toolbox go to .
Select
enmap_berlin.bsqas Raster and under Regression specify the output raster from step 1 (the regression target).Leave the rest at default and under Output Regressor specify an output file path and click Run
In the next step we will apply the regression to the image. Go to . Select
enmap_berlin.bsqas input Raster and under Regressor click … and select the output.pklfile from the Fit RandomForestRegressor algorithm. Specify an output path (Output Regression) and click Run.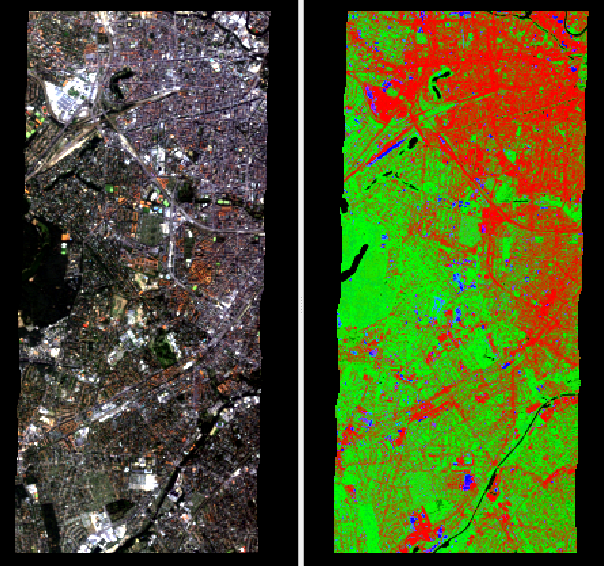
Fig. 20 EnMAP image in true colors (left) and RGB visualisation of the regression result (right) where red=impervious, green=vegetation, blue=soil