Wavelength Information
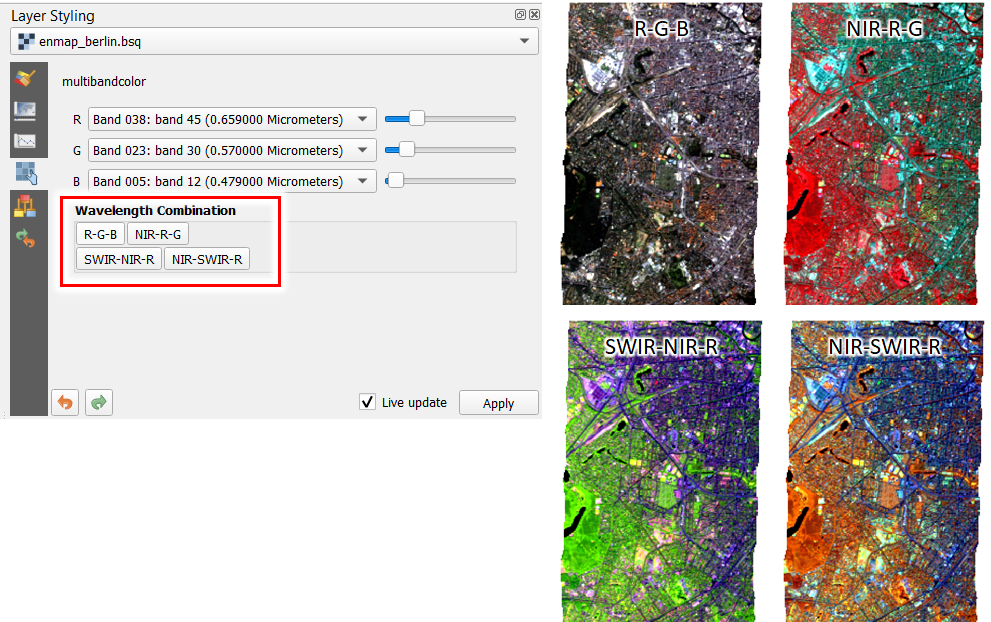
If wavelength information is defined for each band of a raster image, the EnMAP-Box can use it to easily select pre-defined band combinations or to better compare spectral profiles of sensors with different number of bands.
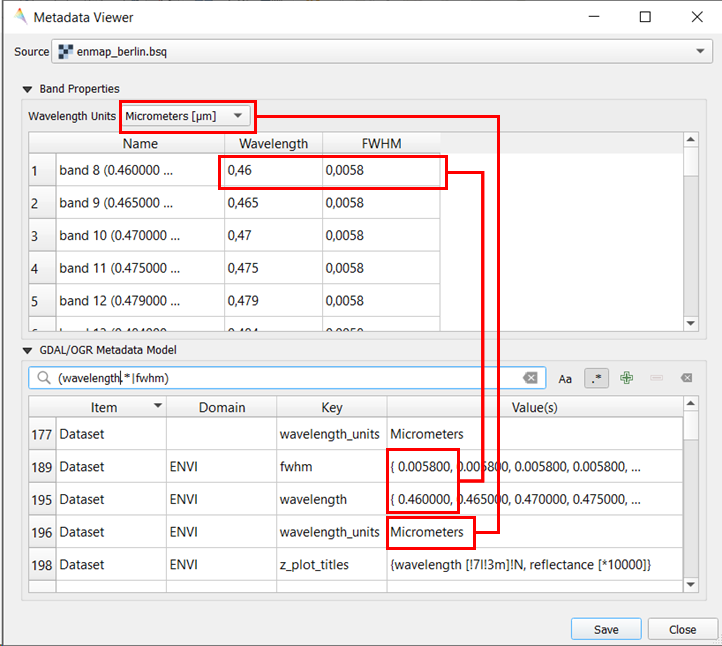
The wavelength information needs to be defined similar to the ENVI metadata standard:
wavelength units defines the metric unit of the wavelength, e.g. nm, mu, cm,..
wavelength defines the band values in wavelength units, e.g. 450 nm.
fwhm defines the full width at half maximum in wavelength units
Wavelength information can be inspected with the Tools -> Metadata Viewer
In the QGIS python shell, wavelength information can be read as followed:
from enmapbox.gui.utils import parseWavelength, parseFWHM
source = 'path to raster file / QgsRasterLayer / GDAL DataSource'
wavelength, wavelength_unit = parseWavelength(source)
fwhm = parseFWHM(source)
print(wavelength)
print(wavelength_unit)
print(fwhm)
Internally, the EnMAP-Box reads wavelength information via the GDAL metadata model:
from osgeo import gdal
path = r'path to image'
dataset: gdal.DataSet = gdal.Open(path)
print(dataset.GetMetadataItem('wavelength_units', 'ENVI'))
print(dataset.GetMetadataItem('wavelengths', 'ENVI'))
Wavelength information can be set in the same way:
from osgeo import gdal
path = r'path to image'
dataset: gdal.DataSet = gdal.Open(path)
print(dataset.SetMetadataItem('wavelength_units', 'nm', 'ENVI'))
print(dataset.SetMetadataItem('wavelengths', '{490, 560, 665}', 'ENVI'))
dataset.FlushCache()
del dataset
Please note that this will only work if the image is not opened in QGIS!.