Classification
This section will demonstrate the process of image classification using the test dataset. In this example we will use the processing algorithms only. For classification purposes you might also want to have a look at the Classification workflow application, which provides a convenient graphical user interface and manages all intermediate steps ‘under the hood’ (see also Getting Started).
Fit a Classifier
The first step towards image classification is to fit a classifier. The available algorithms are listed in the processing
toolbox under . These Fit […] algorithms expect a raster dataset
where samples are extracted from as first input (Raster). The second input is a classification layer
which contains the class labels/target variable (Labels). Optionally you can include a mask layer.
The output of those algorithms is a .pkl file, an intermediate exchange format which stores all relevant information
and will be needed in the consecutive step.

Fig. 15 Fit algorithms and their common window layout
Using vector datasets as reference and input for Labels :
Often reference datasets with class information are available as vector datasets, for example point shapefiles where class information is stored in the attribute table. In order to use this information in the Fit algorithm, the vector dataset has to be converted to a classification raster first. This can be done with the Rasterize categorized vector layer algorithm (in the processing toolbox under ).
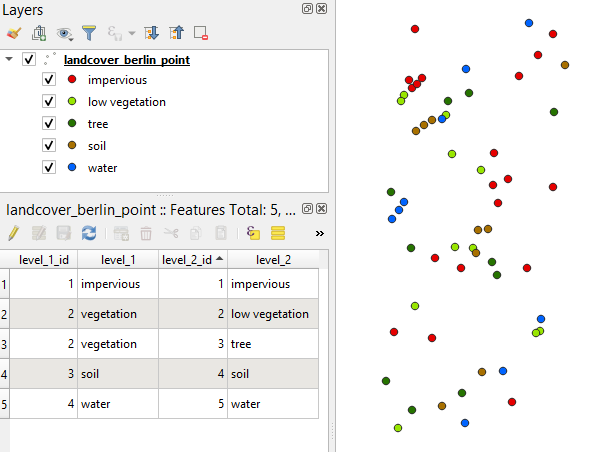
Fig. 16 Example from test dataset: Multipoint layer with class information, coloured by level_2 attribute
Open
Pixel Grid expects a raster layer that defines the target grid based on which the vector geometries will be rasterized
Vector is the reference dataset which should be rasterized
Class id attribute points to the field in the Vector layer which contains the class values (which will become the cell values in the raster)
Minimal overall coverage, Minimal dominant coverage and Oversampling factor are important parameters when working with polygon geometries. For the example we will use a point vector layer, so you can stick with the default values.
Output Classification: Output path for classification raster.
Using the test dataset, enter the following parameters:
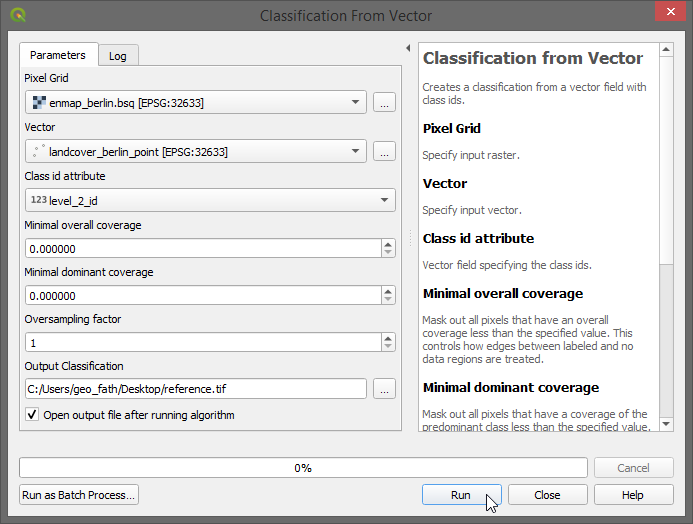
Click Run
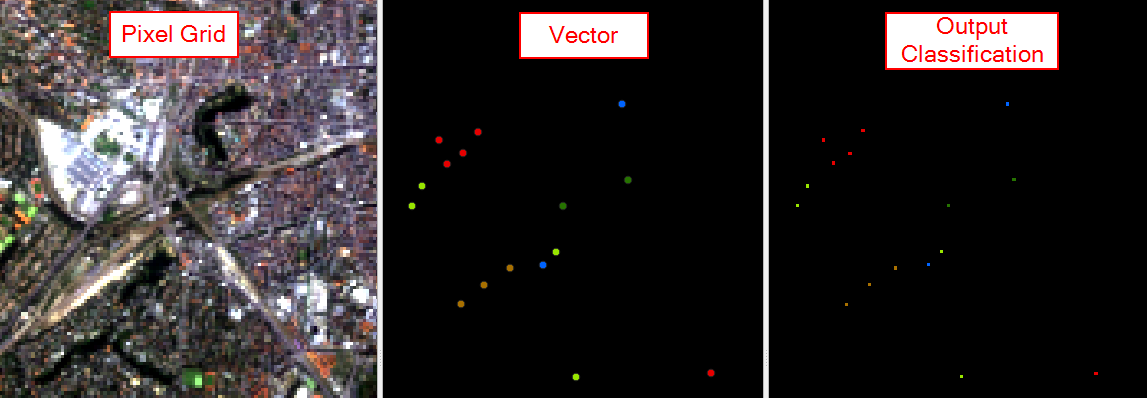
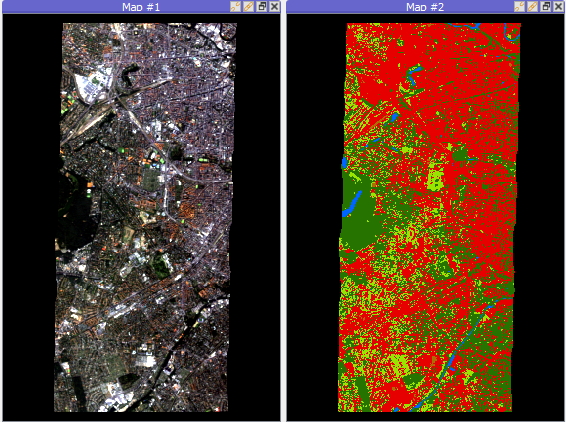
Fig. 17 Side by side: Inputs and Output of Classification from Vector
The generated classification raster can now be used to fit a classifier.
Hint
In order for the Classification from Vector algorithm to know the class labels (names) and colors for rasterization
you need to provide this information in a .json file which has the same basename and is located in the same directory as the
underlying vector dataset. Otherwise random colors will be assigned and labels will be class 1, class 2, class 3 and so on.
For example, the .json file of the landcover_berlin_point.shp (landcover_berlin_point.json) looks like this:
{
  "level_1_id": {
    "categories":  [
      [0, "unclassified", [0, 0, 0]],
      [1, "impervious", [230, 0, 0]],
      [2, "vegetation", [56, 168, 0]],
      [3, "soil", [168, 112, 0]],
      [4, "water", [0,100,255]]
    ],
    "no data value": 0,
    "description": "Classification"
  },
  "level_2_id": {
    "categories":  [
      [0, "unclassified", [0, 0, 0]],
      [1, "impervious", [230, 0, 0]],
      [2, "low vegetation", [152, 230, 0]],
      [3, "tree", [38, 115, 0]],
      [4, "soil", [168, 112, 0]],
      [5, "water", [0,100,255]]
    ],
    "no data value": 0,
    "description": "Classification"
  }
}
Fit Classifier:
Go to and select one of the Fit […] algorithms, for example
Now select
enmap_berlin.bsqas Raster and the output of the Classification from Vector algorithm as Labels, leave the remaining parameters at default and specify an output path (Output Classifier) for the classifier file (.pkl).Click Run.
Predict Classification
In this step the classification will be applied to an image, which is usually (but not necessarily) the same image used in the fitting of the classifier. The algorithm can be found in the same category ().
Select the image you want to classify as Raster and the
.pklfile from the previous step as Classifier.For the test data this might look something like this:
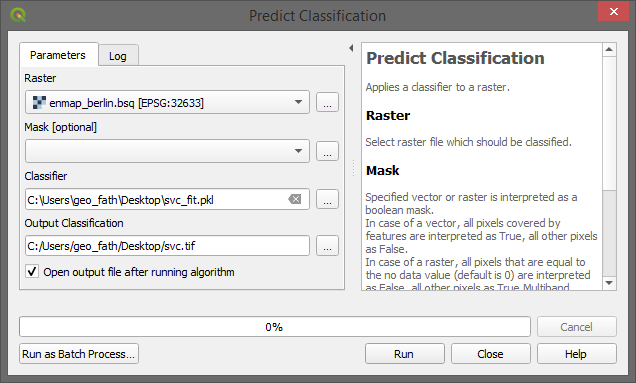
Specify an output path for the classification image and click Run.
Now you should end up with a classified image
Accuracy Assessment
Todo
Under construction…
Tip
If you want to automatize workflows we suggest using the graphical modeler available in QGIS! See the Graphical Modeler recipe in the cookbook on how to create a graphical model for image classification.